- Home
- Getting Started
- Documentation
- Release Notes
- Tour the Interface
- Tour the Layers
- JMARS Video Tutorials
- Lat/Lon Grid Layer
- Map Scalebar
- Nomenclature
- Crater Counting
- 3D
- Shape Layer
- Mosaics
- Map
- Advanced/Custom Maps
- Graphic/Numeric Maps
- Custom Map Sharing
- Stamp
- THEMIS
- MOC
- Viking
- CRISM Stamp Layer
- CTX
- HiRise
- HiRISE Anaglyph
- HiRISE DTM
- HRSC
- OMEGA
- Region of Interest
- TES
- THEMIS Planning
- Investigate Layer
- Landing Site Layer
- Tutorials
- Video Tutorials
- Displaying the Main View in 3D
- Finding THEMIS Observation Opportunities
- Submitting a THEMIS Region of Interest
- Loading a Custom Map
- Viewing TES Data in JMARS
- Using the Shape Layer
- Shape Layer: Intersect, Merge, and Subtract polygons from each other
- Shape Layer: Ellipse Drawing
- Shape Layer: Selecting a non-default column for circle-radius
- Shape Layer: Selecting a non-default column for fill-color
- Shape Layer: Add a Map Sampling Column
- Shape Layer: Adding a new color column based on the values of a radius column
- Shape Layer: Using Expressions
- Using JMARS for MSIP
- Introduction to SHARAD Radargrams
- Creating Numeric Maps
- Proxy/Firewall
- JMARS Shortcut Keys
- JMARS Data Submission
- FAQ
- Open Source
- References
- Social Media
- Podcasts/Demos
- Download JMARS
Map2 Layer
The Map2 Layer is only used in the Webstart version of JMARS and allows users to display many global maps currently not available in the Graphical Maps and Numeric Maps layers.
Using the Map2 Layer
-
- Open the Map2 Layer: In the Layer Manager, chose "Add NEw Layer" -> "Map2"
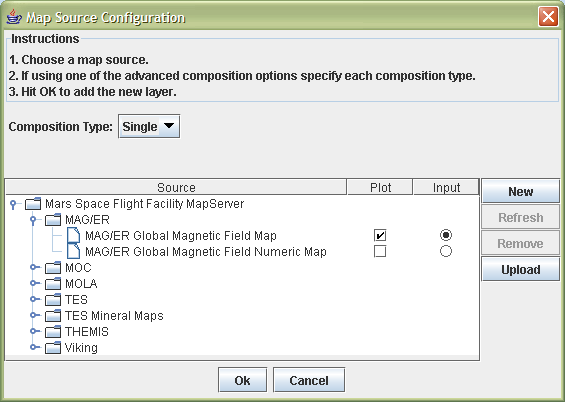
- Chose a Map: In the pop-up window, the available maps are shown in the Map Source table, organized by the instruments used to create them. To select a map, left-click on it to highlight the map name and the click on the radio button under "Input".
- Select Plot Option: Like the JMARS Numerical Map Layer, the Map2 Layer will allow the user to draw profile lines in the Main View and see the graph of those numerical values in the Map2 focus panel. Clicking on the checkbox under "Plot" will enable this option.
- Open the Map: Click the "Ok" button once all the options have been set.