- Home
- Getting Started
- Documentation
- Release Notes
- Tour the Interface
- Tour the Layers
- JMARS Video Tutorials
- Lat/Lon Grid Layer
- Map Scalebar
- Nomenclature
- Crater Counting
- 3D
- Shape Layer
- Mosaics
- Map
- Advanced/Custom Maps
- Graphic/Numeric Maps
- Custom Map Sharing
- Stamp
- THEMIS
- MOC
- Viking
- CRISM Stamp Layer
- CTX
- HiRise
- HiRISE Anaglyph
- HiRISE DTM
- HRSC
- OMEGA
- Region of Interest
- TES
- THEMIS Planning
- Investigate Layer
- Landing Site Layer
- Tutorials
- Video Tutorials
- Displaying the Main View in 3D
- Finding THEMIS Observation Opportunities
- Submitting a THEMIS Region of Interest
- Loading a Custom Map
- Viewing TES Data in JMARS
- Using the Shape Layer
- Shape Layer: Intersect, Merge, and Subtract polygons from each other
- Shape Layer: Ellipse Drawing
- Shape Layer: Selecting a non-default column for circle-radius
- Shape Layer: Selecting a non-default column for fill-color
- Shape Layer: Add a Map Sampling Column
- Shape Layer: Adding a new color column based on the values of a radius column
- Shape Layer: Using Expressions
- Using JMARS for MSIP
- Introduction to SHARAD Radargrams
- Creating Numeric Maps
- Proxy/Firewall
- JMARS Shortcut Keys
- JMARS Data Submission
- FAQ
- Open Source
- References
- Social Media
- Podcasts/Demos
- Download JMARS
Create a numeric map from JMARS in ArcGIS
Want to create a numeric map? This tutorial will demonstrate the process of turning pixel data information from JMARS into a numeric elevation map in ArcGIS.
First, Let's start in JMARS. Open JMARS.
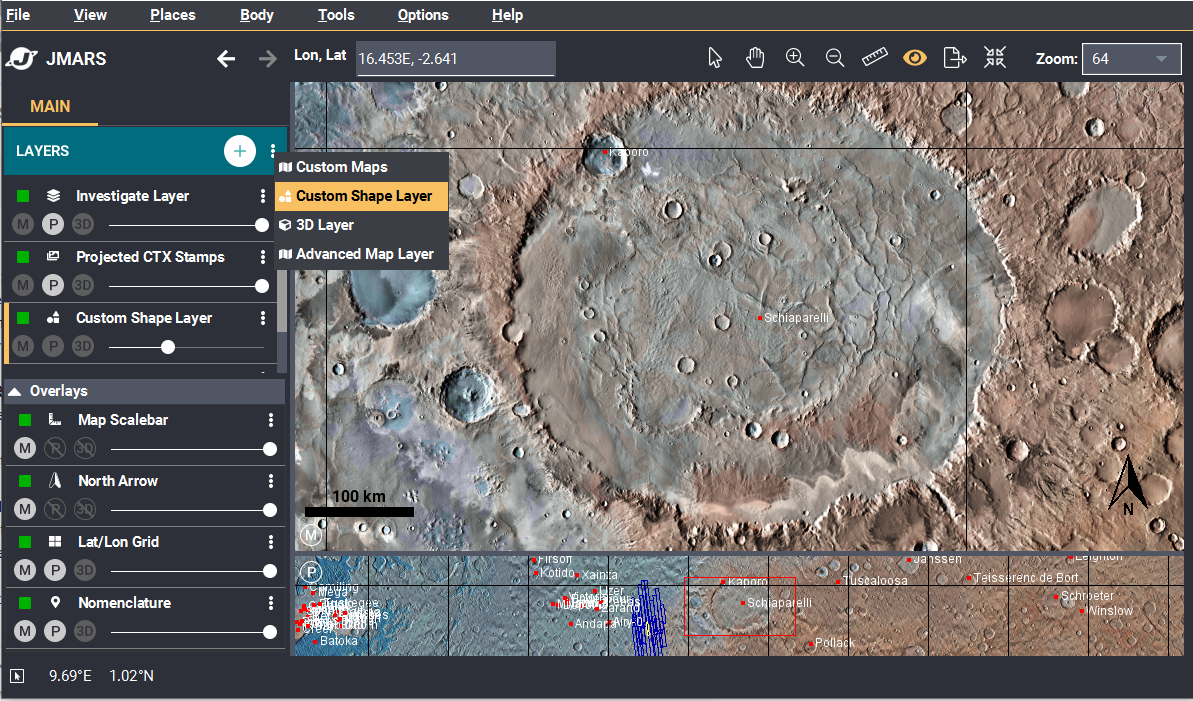
- Open JMARS and locate the area of interest. Add the Custom Shape Layer to the Layer Manager. Add the Custom Shape Layer by clicking on the Layers shortcut (three dots next to the "+" sign)
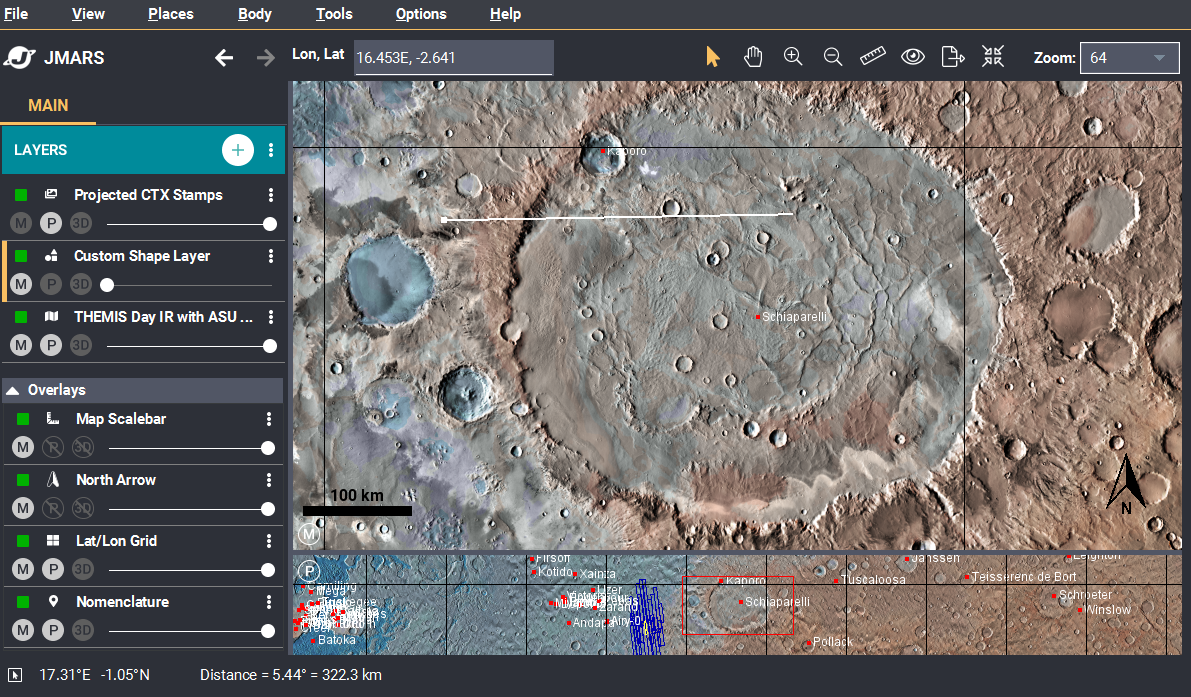
- Create a polygon over the area of interest: Make sure the Custom Shape Layer is selected in the Layer Manager. Then, right click on the main view and select "Add Polygons".
- Create a polygon. One click adds a point. Two clicks completes the polygon.
- When your polygon is created, select the polygon: Right click the main screen again --> select "Select Features". Click your polygon. The polygon should now be outlined in yellow if it is successfully selected.
- Right Click the screen again. Locate the "Polygon Functions" at the bottom of the list. Put your mouse on the "Polygon Functions" to expand the next drop down and select "Export Pixel Data for Polygons"
- The Pixel Data CSV Export Window opens. Make sure the "Pixel ID", "Latitude" and "Longitude" boxes are all selected at the top of the window. Now, click the "ADD SOURCE" button.
- The Numeric Map Source Selection Dialog opens. This is where you will select the source dataset that you want to export. This tutorial is going to use MOLA Elevation data. You can use the "Filter" search to find the source you are looking for or you can scroll through the datasets until you find the one you would like to use. Once you find the dataset you're looking for, select it and press the "OK" button.
- Next, click the "SELECT FILE..." button to select where you'd like to save your CSV. When you have selected the location, Click "SAVE" to complete the Pixel Export process.


A CSV file should be created with four columns, OID, Lat, Lon and Elevation.
Now, Let's open ArcGIS.
Now that we've created a CSV that contains our numeric information, we need to bring the CSV into ArcGIS and create our map.
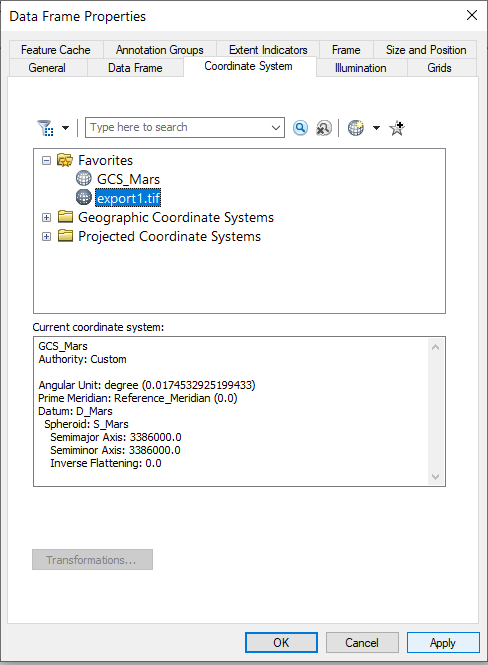
- Before we add the CSV data into ArcGIS, we need to apply our Projection/Geographic Coordinate System. Double click "Layers".
- The Data Frame Properties dialog window should open. Now, you need to apply the JMARS projection to our data. An easy way to do this is to download the PRJ file and to import that PRJ file into ArcGIS. CLICK HERE to download the prj file. When the PRJ is downloaded, click the globe button and go to "Import". Locate the PRJ file and apply the projection. NOTE: In the screenshot below, the PRJ file was named "export1.tif". The downloaded PRJ file name you will upload is "JMARS_Projection_File.prj". After you import the PRJ file, Click the "Apply" button. Then, click the "OK" button.
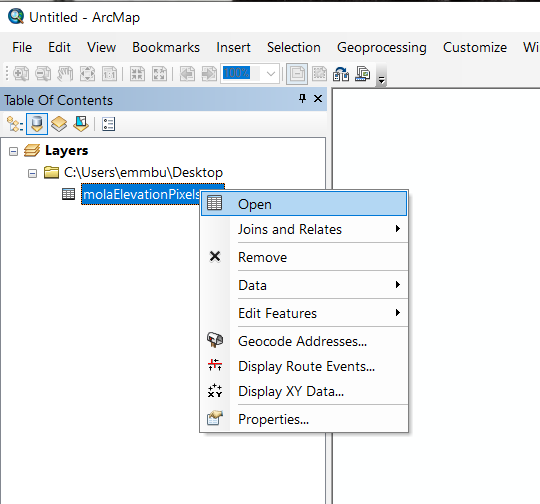
- Add the CSV into ArcGIS. This will add the CSV into the Layer Manager on the left hand side.
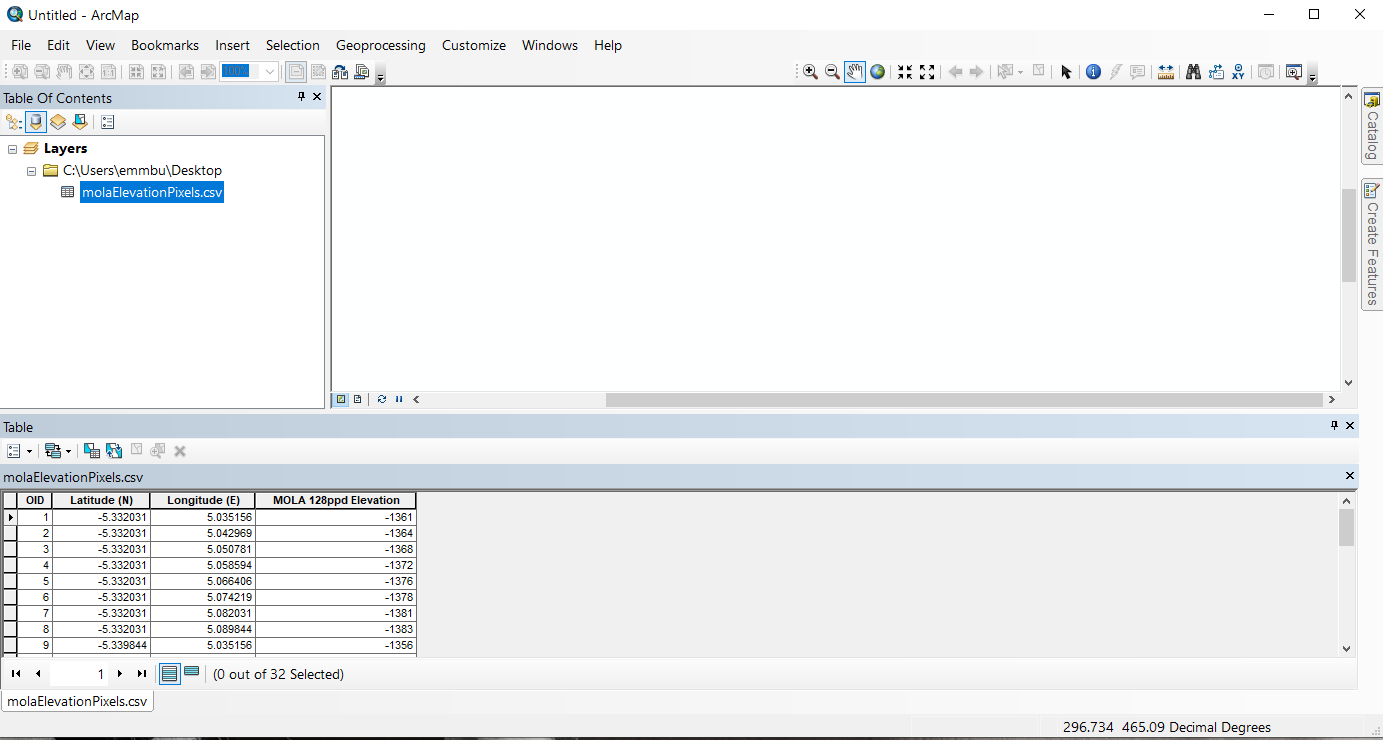
- Now, open the CSV attribute table. Click on the CSV in the layer manager so it is selected. Then, right click the selected CSV and click "Open". The attribute table should open showing you the contents of the CSV.
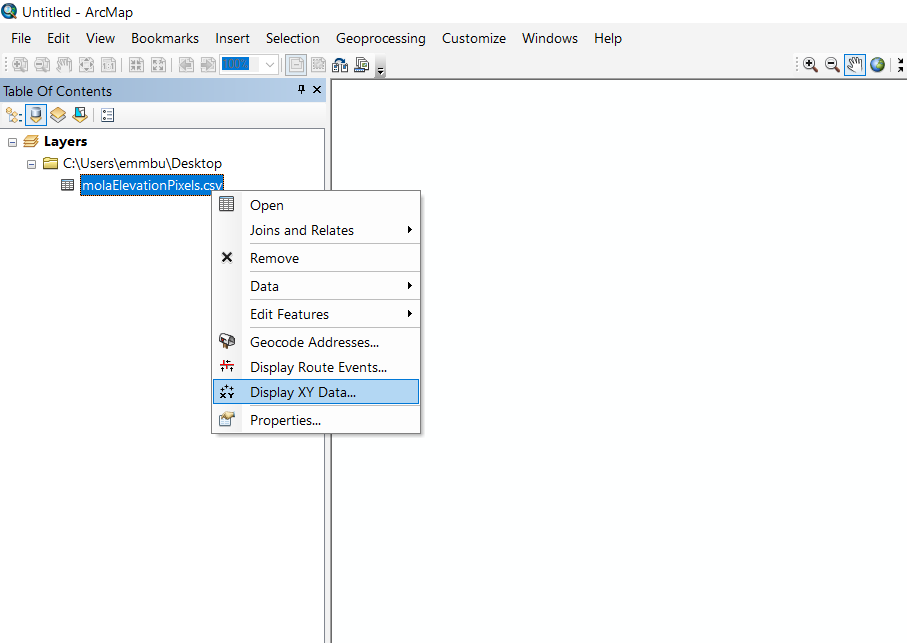
- If the CSV file isn't selected (highlighted in blue), click it to select it. Now, right click the CSV and go to "Display XY Data..."
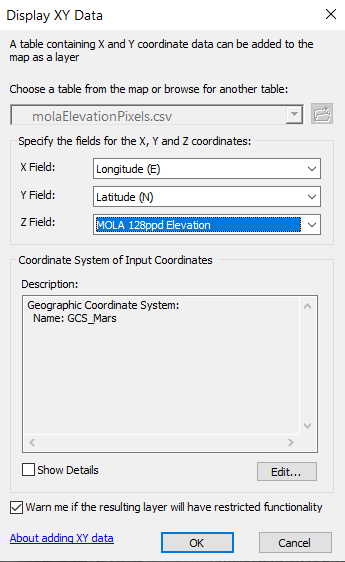
- The Display XY Data dialog window should pop up. You'll want to apply the XYZ to our CSV. First, make sure the correct file is showing under "Choose a table from...". Click the X Field drop down and select "Longitude (E)". Click the Y Field drop down and select "Latitude N". Select the Z Field drop down and select the dataset value, in this tutorials case, we used MOLA elevation. So, I am entering the MOLA 128pp Elevation for my Z value. Make sure the Coordinate system isn't empty. After your window looks similar to the screenshot below, click "OK".
- Points representing each Lat/lon value should be created. In the screenshot below, we are zoomed out so you can see the entire dataset but if you were to zoom in, you would see a serious of points for each row in our CSV.
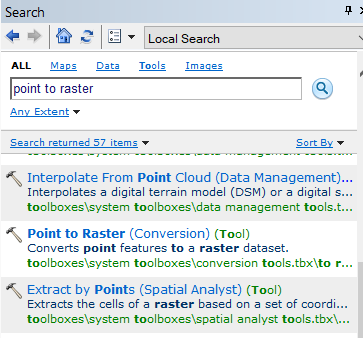
- Now we can run the tool to produce a raster from our points. Go to the search tab and search for "Point to Raster". When you locate the tool, double click it so the dialog window opens.
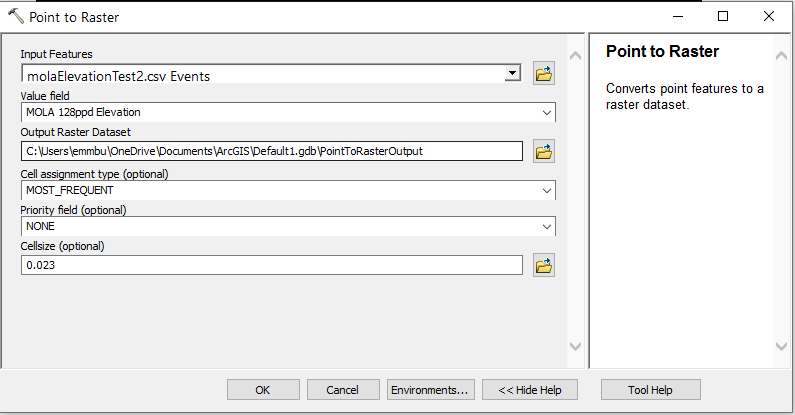
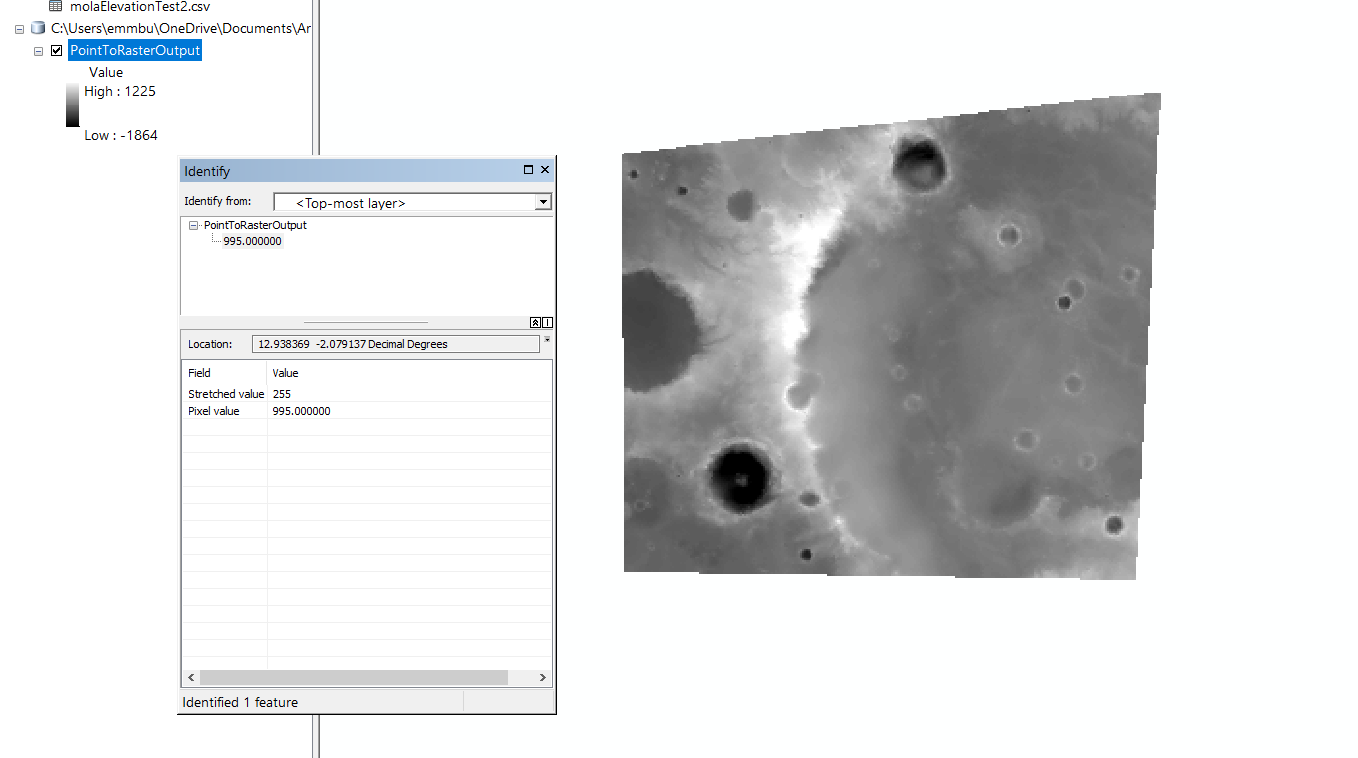
- Make sure the Input Features has the points dataset we just created. Also, make sure the Value Field has the elevation dataset selected. Create an output name in the Output Raster Dataset and press "OK". This will create our new raster image. In the image below, a point on the map was clicked to make sure the elevation data was successfully applied. The elevation shown is in meters.