
- Home
- Getting Started
- Documentation
- Release Notes
- Tour the Interface
- Tour the Layers
- JMARS Video Tutorials
- Lat/Lon Grid Layer
- Map Scalebar
- Nomenclature
- Crater Counting
- 3D
- Shape Layer
- Mosaics
- Map
- Advanced/Custom Maps
- Graphic/Numeric Maps
- Custom Map Sharing
- Stamp
- THEMIS
- MOC
- Viking
- CRISM Stamp Layer
- CTX
- HiRise
- HiRISE Anaglyph
- HiRISE DTM
- HRSC
- OMEGA
- Region of Interest
- TES
- THEMIS Planning
- Investigate Layer
- Landing Site Layer
- Tutorials
- Video Tutorials
- Displaying the Main View in 3D
- Finding THEMIS Observation Opportunities
- Submitting a THEMIS Region of Interest
- Loading a Custom Map
- Viewing TES Data in JMARS
- Using the Shape Layer
- Shape Layer: Intersect, Merge, and Subtract polygons from each other
- Shape Layer: Ellipse Drawing
- Shape Layer: Selecting a non-default column for circle-radius
- Shape Layer: Selecting a non-default column for fill-color
- Shape Layer: Add a Map Sampling Column
- Shape Layer: Adding a new color column based on the values of a radius column
- Shape Layer: Using Expressions
- Using JMARS for MSIP
- Introduction to SHARAD Radargrams
- Creating Numeric Maps
- Proxy/Firewall
- JMARS Shortcut Keys
- JMARS Data Submission
- FAQ
- Open Source
- References
- Social Media
- Podcasts/Demos
- Download JMARS
Shape Layer: Add a Map Sampling Column
The purpose of this tutorial is to walk users through the process of opening JMARS, opening the Shape Layer and adding a new column that contains data obtained by sampling the particular map.
Step 1: Opening JMARS and adding the Shape Layer
- Double-click the JMARS icon on your desktop to open JMARS
- Enter your JMARS user name and password. If you do not have a user name and password, follow the instruction under the appropriate "Getting Started" link on the Main Page.
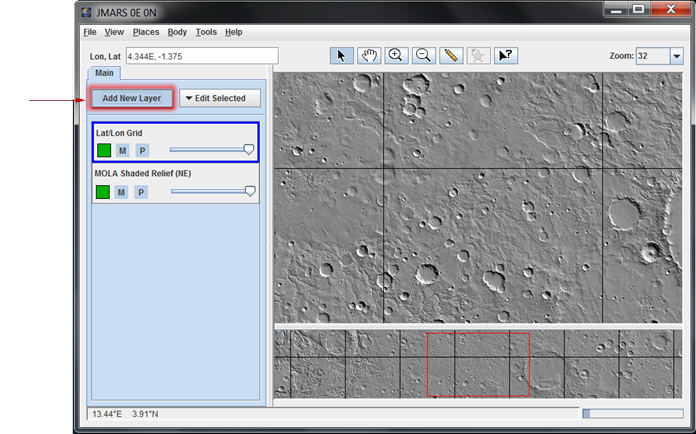
- At this point, the Layer Manager should only have the MOLA Shaded Relief Layer and the Lat/Lon Layer loaded.
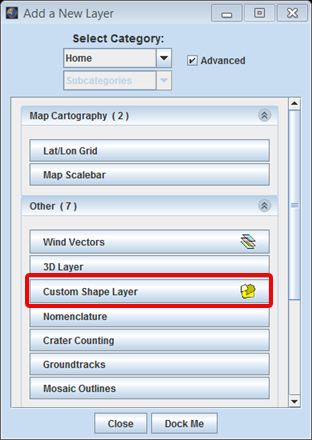
- In the Layer Manager, click "Add New Layer" -> "Custom Shape Layer", then double click on the "Custom Shape Layer" tab to access the focus panel.
Step 2: Adding a new column that contains maximum elevation under shapes
- In the Shape Layer focus panel click on "Feature" -> "Edit Columns...".

- In the new "Edit Columns" window that opens up, type the name of the new column (max elevation) and select its type as Map Sampling from the Type drop-down menu. Click on Add Column.

- The new column name together with its type appears in the list of columns. The description of the column is also displayed. We are using MOLA 128ppd data as the source and are sampling it for the maximum elevation. So select MAX from the Stat drop-down menu. Click Okay.

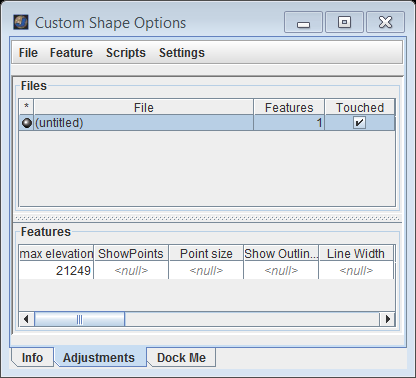
- The new column just created appears as a column under Features in the Shape Layer focus panel

Step 3: Viewing the maximum elevation under the shapes added.
- Add shapes to the shape layer as covered in the previous tutorials.
- The maximum elevation for each of the added shape appears under the max elevation column in the Shape Layer focus panel. We have added a circle at Olympus Mons (226E, 18.4) and the maximum elevation at Olympus Mons is displayed.

Congratulations! You have finished the tenth JMARS tutorial!
Congratulations! You have finished the tenth JMARS tutorial!