
- Home
- Getting Started
- Documentation
- Release Notes
- Tour the Interface
- Tour the Layers
- JMARS Video Tutorials
- Lat/Lon Grid Layer
- Map Scalebar
- Nomenclature
- Crater Counting
- 3D
- Shape Layer
- Mosaics
- Map
- Advanced/Custom Maps
- Graphic/Numeric Maps
- Custom Map Sharing
- Stamp
- THEMIS
- MOC
- Viking
- CRISM Stamp Layer
- CTX
- HiRise
- HiRISE Anaglyph
- HiRISE DTM
- HRSC
- OMEGA
- Region of Interest
- TES
- THEMIS Planning
- Investigate Layer
- Landing Site Layer
- Tutorials
- Video Tutorials
- Displaying the Main View in 3D
- Finding THEMIS Observation Opportunities
- Submitting a THEMIS Region of Interest
- Loading a Custom Map
- Viewing TES Data in JMARS
- Using the Shape Layer
- Shape Layer: Intersect, Merge, and Subtract polygons from each other
- Shape Layer: Ellipse Drawing
- Shape Layer: Selecting a non-default column for circle-radius
- Shape Layer: Selecting a non-default column for fill-color
- Shape Layer: Add a Map Sampling Column
- Shape Layer: Adding a new color column based on the values of a radius column
- Shape Layer: Using Expressions
- Using JMARS for MSIP
- Introduction to SHARAD Radargrams
- Creating Numeric Maps
- Proxy/Firewall
- JMARS Shortcut Keys
- JMARS Data Submission
- FAQ
- Open Source
- References
- Social Media
- Podcasts/Demos
- Download JMARS
Thermal Emission Spectrometer (TES) Layer
The TES Layer allows users to display spectral data collected by ASU's Thermal Emission Spectrometer on Mars Global Surveyor. It is mostly used for reconnaissance purposes, allowing users to identify spectra of interest which can then be pulled directly from the database and analyzed using other tools. The TES Layer is currently only available in the THEMIS Team Release of JMARS.
Open the TES Layer
- Open the TES Layer: Chose "Add New Layer" ->
"TES" and then click on the "TES" Tab to access the focus panel.
- The focus panel will appear blank since there is not an open "context".
- A context is the set of database search parameters and display options which tells the TES Layer what data must be retrieved from the TES database. (Due to the large amount of data in the TES database, the TES Layer can only display a small fraction of it.)
- Add a New Context: Click on the "Add" button at the bottom of the focus panel. The focus panel will then
fill with the various fields needed for creating a context.
- Specify the Context Parameters: Enter values in the various fields and drop-down menus to create a context
- The amount of TES data pulled by a context can be extremely large, which can make the TES Layer very slow. Users should start by over-constraining their search for TES data and then gradually relax those constraints as needed.
- To help the TES Layer refresh faster, reduce the size of the Viewing Window as much as you can. Next, increase the zoom of the Main View as much as you can. If you would like the TES Layer to load even faster, un-check the "P" next to the TES Layer in the Main Tab of the Layer Manager. This will prevent TES data from being displayed in the Panner window.
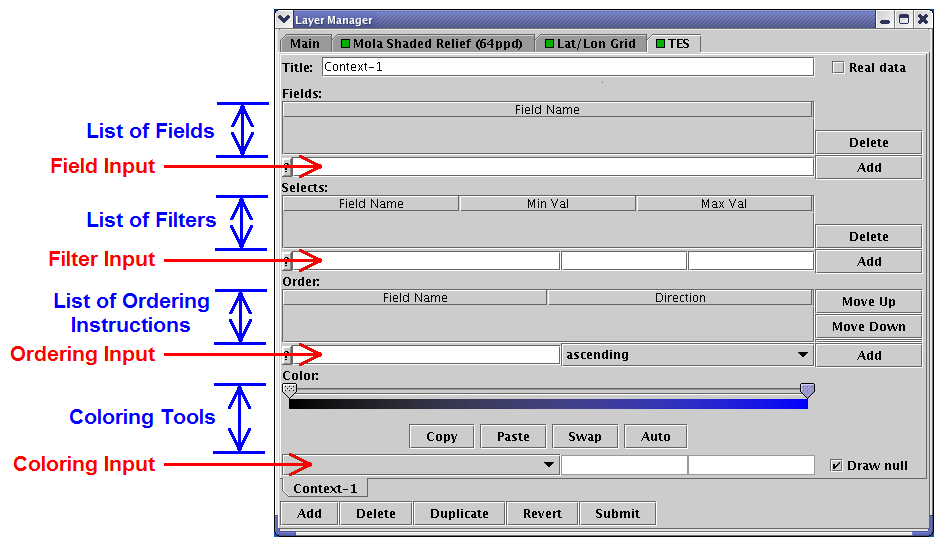
- Title: Users can specify the name of the current context by changing the name in this field. The focus panel will allow the user to open multiple contexts, which are listed at the bottom of the focus panel as tabs with the specified titles.
- Real Data: If users view TES data at 128 ppd or lower resolutions, by default JMARS will not display the data at it's full resolution in order to reduce the time needed to load all the data. However, if you want to view the full resolution data at low zoom levels, check this box. At zoom levels of 256 or higher this checkbox has no effect since the real data is already being displayed.
- Fields: Since the TES database contains 153 fields, which all have data for every TES observation, JMARS does not load in any data by default. Instead, it allows users to specify which database fields they want to load into JMARS. There are two ways to add a field: 1) type the name of the field in the input box and click "Add" or 2) click on the "?" button to the left of the input box to get a list of all available fields, highlight the field you want to add, click the "To Fields" button on the right side of the pop-up screen and then click "Add" in the "Fields" section of the focus panel.
- Selects: This section allows users to specify which data from the selected fields to load into JMARS. In the input box in the "Selects" section, users must enter a field name (which also has to be listed in the "Fields" section above), a minimum value and a maximum value. Users must then click "Add" to incorporate the information into the context.
- Order: The "Order" section allows users to specify the order in which JMARS draws the selected observations footprints. (ie: the footprints can be drawn by orbit number in ascending order, surface temperature in descending order, etc)
- Color: The "Color" section allows users to colorize the TES data displayed in the Viewing Window based on the value of the data. First, select a color scheme by right-clicking on one of the sliders on the color bar and then either "Set Tab Color" (to select simple colors) or "Built-In Colors" (to select more complex color spectra). Second, users must select which database field will be used to colorize the data from the available fields in the drop-down menu in the "Color" section. Third, users must enter a minimum and maximum values in the boxes to the right of the pull-down menu. If the field you wish to colorize is loaded into the "Fields" section but is not visible in the "Color" section's drop-down box, this means that the data in that field is not compatible with the colorization tool. (ie: it does not contain single-value data)
- Context Control Buttons
- Add: Creates a new TES context. Multiple contexts can be open simultaneously, but only one can be displayed in the Viewing Window at a time.
- Delete: Deletes the selected context.
- Duplicate: Creates a copy of the selected context.
- Revert: Returns the selected context the its state when the last "Submit" was made.
- Submit: Submits a request for data to the TES database based on the specifications in the selected context.
- Submit Data Request: After parameters have been entered for all of the necessary fields, clicking the "Submit" button at the bottom of the focus panel will request the specified data from the TES database. Depending on the amount of data requested, it may take a while for the TES Layer to draw the data footprints in the Viewing Window.
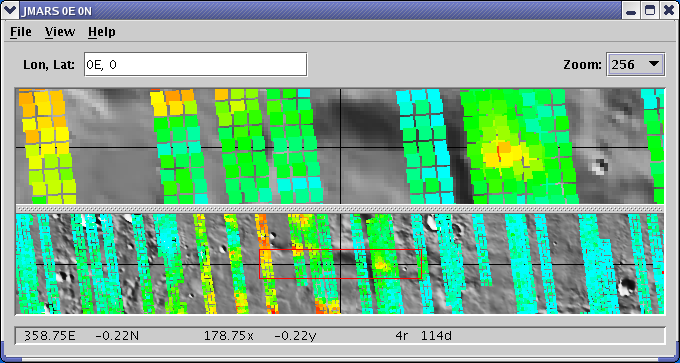
Viewing TES Data
- Selecting a Footprint: Once the TES footprints have been displayed in the Main View, clicking on a
footprint will open a data window with the data associated with the selected footprint.
- The data window will only display data for the fields listed in the "Fields" section of the focus panel.
- Since many TES observations can overlap each other, the data window will display information for all of the observations that cover the selected point.
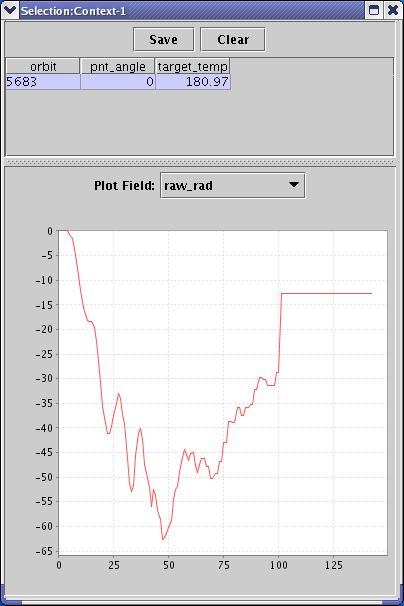
- Viewing Single-Value Data: Fields that contain single-value data (ie: temperature, mirror pointing angle, etc) will be shown in the top half of the data window as a table of values. This table can be sorted by any of the fields by clicking on the title of any column.
- Graphing Array Data: Fields that contain multiple values (ie: raw radiance, etc) can not be easily shown
in the data table, but they can be graphed by selecting the field name from the pull-down menu in the middle of
the data window. Then select one of the observation rows from the data table at the top of the window and the
specified field for that observation will be graphed.
- Users can graph data from multiple observations by selecting multiple observations (Ctrl+left-click).
- Saving the TES Data: To save the TES data displayed in the data window, click the "Save" button at the top of the window and specify a file name and path.
- Clearing the Selected TES Data: Clicking on the "clear" button at the top of the data window will remove all of the displayed data.


Related Pages
- Tutorial #6: Viewing TES Data in JMARS