
- Home
- Getting Started
- Documentation
- Release Notes
- Tour the Interface
- Tour the Layers
- JMARS Video Tutorials
- Lat/Lon Grid Layer
- Map Scalebar
- Nomenclature
- Crater Counting
- 3D
- Shape Layer
- Mosaics
- Map
- Advanced/Custom Maps
- Graphic/Numeric Maps
- Custom Map Sharing
- Stamp
- THEMIS
- MOC
- Viking
- CRISM Stamp Layer
- CTX
- HiRise
- HiRISE Anaglyph
- HiRISE DTM
- HRSC
- OMEGA
- Region of Interest
- TES
- THEMIS Planning
- Investigate Layer
- Landing Site Layer
- Tutorials
- Video Tutorials
- Displaying the Main View in 3D
- Finding THEMIS Observation Opportunities
- Submitting a THEMIS Region of Interest
- Loading a Custom Map
- Viewing TES Data in JMARS
- Using the Shape Layer
- Shape Layer: Intersect, Merge, and Subtract polygons from each other
- Shape Layer: Ellipse Drawing
- Shape Layer: Selecting a non-default column for circle-radius
- Shape Layer: Selecting a non-default column for fill-color
- Shape Layer: Add a Map Sampling Column
- Shape Layer: Adding a new color column based on the values of a radius column
- Shape Layer: Using Expressions
- Using JMARS for MSIP
- Introduction to SHARAD Radargrams
- Creating Numeric Maps
- Proxy/Firewall
- JMARS Shortcut Keys
- JMARS Data Submission
- FAQ
- Open Source
- References
- Social Media
- Podcasts/Demos
- Download JMARS
Numeric Maps
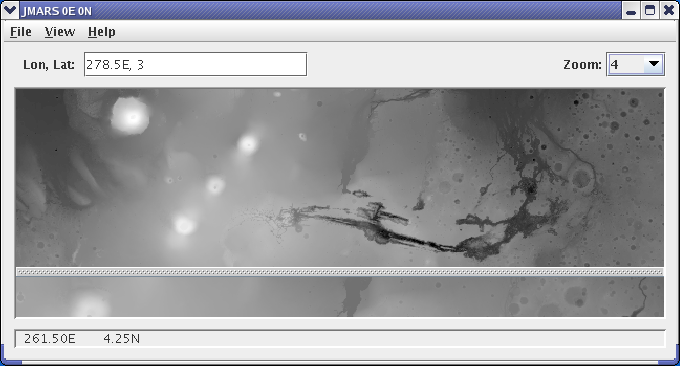
The Numeric Map Layer allows users to load maps based on numerical data, which is then colorized and displayed in the Main View. Unlike the Graphic Map Layer. the Numeric Map Layer gives users access to the actual data behind the map through the focus panel. The user can specify what data to extract from the numeric map by drawing a profile line on the colorized version of the map in the Viewing Window.
Using the Numeric Map Layer
-
- Open the Numeric Map Layer: Chose "Add New Layer" -> "Numeric Map" -> Choose a Numeric Map
- Change Graph Colors: Clicking on the color box to the right of the numeric map's name will allow the user to change the color given to the map's data when it is drawn in the graphing window.
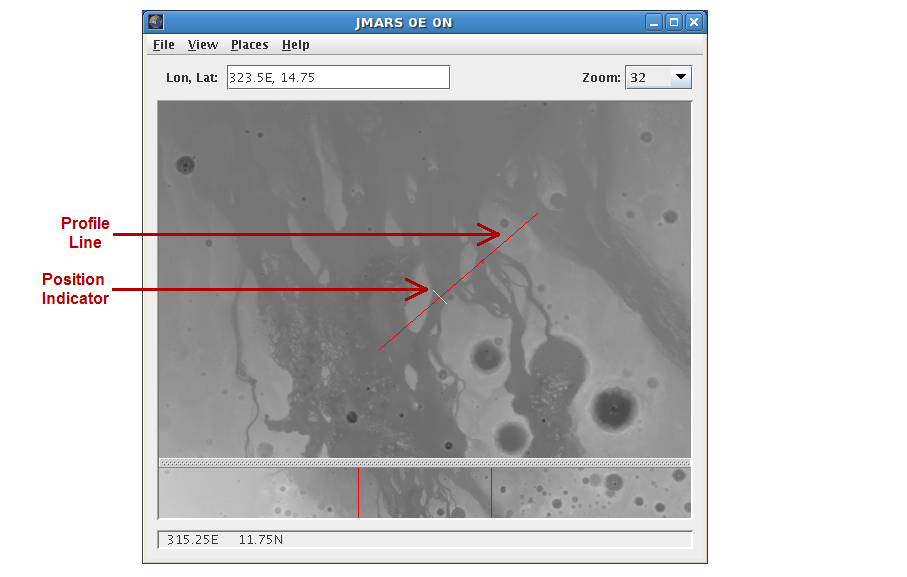
- Draw a Profile Line: In the Viewing Window, left-click and drag to draw a profile line. The data along that line will be graphed in the focus panel's graphing window.
- Retrieving Specific Data Points: To read the exact values of the graph at a given point, move the cursor to the desired point. The x-axis value is the position along the profile line and the y-axis value is the value obtained from the selected numeric map at that position. The y-axis value is displayed to the right of the numeric map's name in the focus panel.
- Zooming in the Graphing Window: Left-clicking and dragging in the focus panel's graphing window will create a box. When users release the left-click button the graphing window will zoom in on the selected area.
- Changing Input Parameters" Clicking on the "Input" tab at the bottom of the focus panel will open the input parameters for the given numeric map.
-
-
- In the "Source" section, the names of all the loaded numeric maps are displayed. Users can change the colorization scheme of each map by using the drop-down menu on the right-hand side.
- In the "Grayscale" Section, users can change the minimum and maximum values of the grayscale coloring scheme or set to automatic by clicking on the "Auto" checkbox.
-
-
- Using the "Configure" button: The configure button will open up a window for editing the Map Layer settings. The Graphic and Numeric Map Layers are now simplified versions of the Advanced Map Layer with interfaces that long-time users will recognize. Clicking on the "Configure" button will open up the settings window associated with the Advanced Map Layer and give users full control over all map settings. For more information, visit the Advanced Map Layer page.

Available Numeric Maps
- Detailed information about the following maps can be found on the JMARS Data Sets page.
- MAG/ER: The MAG/ER map was produced using the numeric data from the Magnetometer/Electron Reflectometer experiment aboard Mars Global Surveyor.
-
-
- MAG/ER Global Magnetic Field
-
- MOLA Maps: The MOLA maps were produced using the numeric data from the Mars Orbital Laser Altimeter aboard Mars Global Surveyor.
-
-
- MOLA Elevation and Topography
- MOLA Radii
-
- TES Maps: These TES maps were created from the numeric data collected by ASU's Thermal Emission Spectrometer aboard the Mars Global Surveyor
-
-
- TES Albedo Numeric
- TES Thermal Inertia (Christensen)
- TES Thermal Inertia (Putzig et al.)
-
- TES Mineral Maps: These TES maps were created by processing data the numeric data from ASU's Thermal Emission Spectrometer aboard the Mars Global Surveyor
-
-
- TES Amphibole
- TES Andesite
- TES Basalt
- TES Carbonate
- TES Hematite
- TES High-Ca Pyroxene
- TES K-Feldspar
- TES Low-Ca Pyroxene
- TES Olivine
- TES Plagioclase
- TES Quartz
- TES RMS Error
- TES Sheet Silicates/High-Si Glass
- TES Sulfate
- TES Surface Dust
-
- Viking Maps: The Viking maps were produced from the numeric data collected by various instruments aboard the two Viking orbiters.
-
-
- Viking IRTM Albedo (Numeric)
- Viking IRTM Fine-Component Thermal Inertia
- Viking IRTM "High-Resolution" Thermal Inertia
- Viking IRTM Thermal Inertia
-