- Home
- Getting Started
- Documentation
- Release Notes
- Tour the Interface
- Tour the Layers
- JMARS Video Tutorials
- Lat/Lon Grid Layer
- Map Scalebar
- Nomenclature
- Crater Counting
- 3D
- Shape Layer
- Mosaics
- Map
- Advanced/Custom Maps
- Graphic/Numeric Maps
- Custom Map Sharing
- Stamp
- THEMIS
- MOC
- Viking
- CRISM Stamp Layer
- CTX
- HiRise
- HiRISE Anaglyph
- HiRISE DTM
- HRSC
- OMEGA
- Region of Interest
- TES
- THEMIS Planning
- Investigate Layer
- Landing Site Layer
- Tutorials
- Video Tutorials
- Displaying the Main View in 3D
- Finding THEMIS Observation Opportunities
- Submitting a THEMIS Region of Interest
- Loading a Custom Map
- Viewing TES Data in JMARS
- Using the Shape Layer
- Shape Layer: Intersect, Merge, and Subtract polygons from each other
- Shape Layer: Ellipse Drawing
- Shape Layer: Selecting a non-default column for circle-radius
- Shape Layer: Selecting a non-default column for fill-color
- Shape Layer: Add a Map Sampling Column
- Shape Layer: Adding a new color column based on the values of a radius column
- Shape Layer: Using Expressions
- Using JMARS for MSIP
- Introduction to SHARAD Radargrams
- Creating Numeric Maps
- Proxy/Firewall
- JMARS Shortcut Keys
- JMARS Data Submission
- FAQ
- Open Source
- References
- Social Media
- Podcasts/Demos
- Download JMARS
JMARS release 5.6.0
JMARS release 5.6.0 introduces major upgrades to the Crater Counting Profile Viewer, adds 3D map spin functionality, and enables custom charting directly from data tables.
Here's what's new in the release 5.6.0
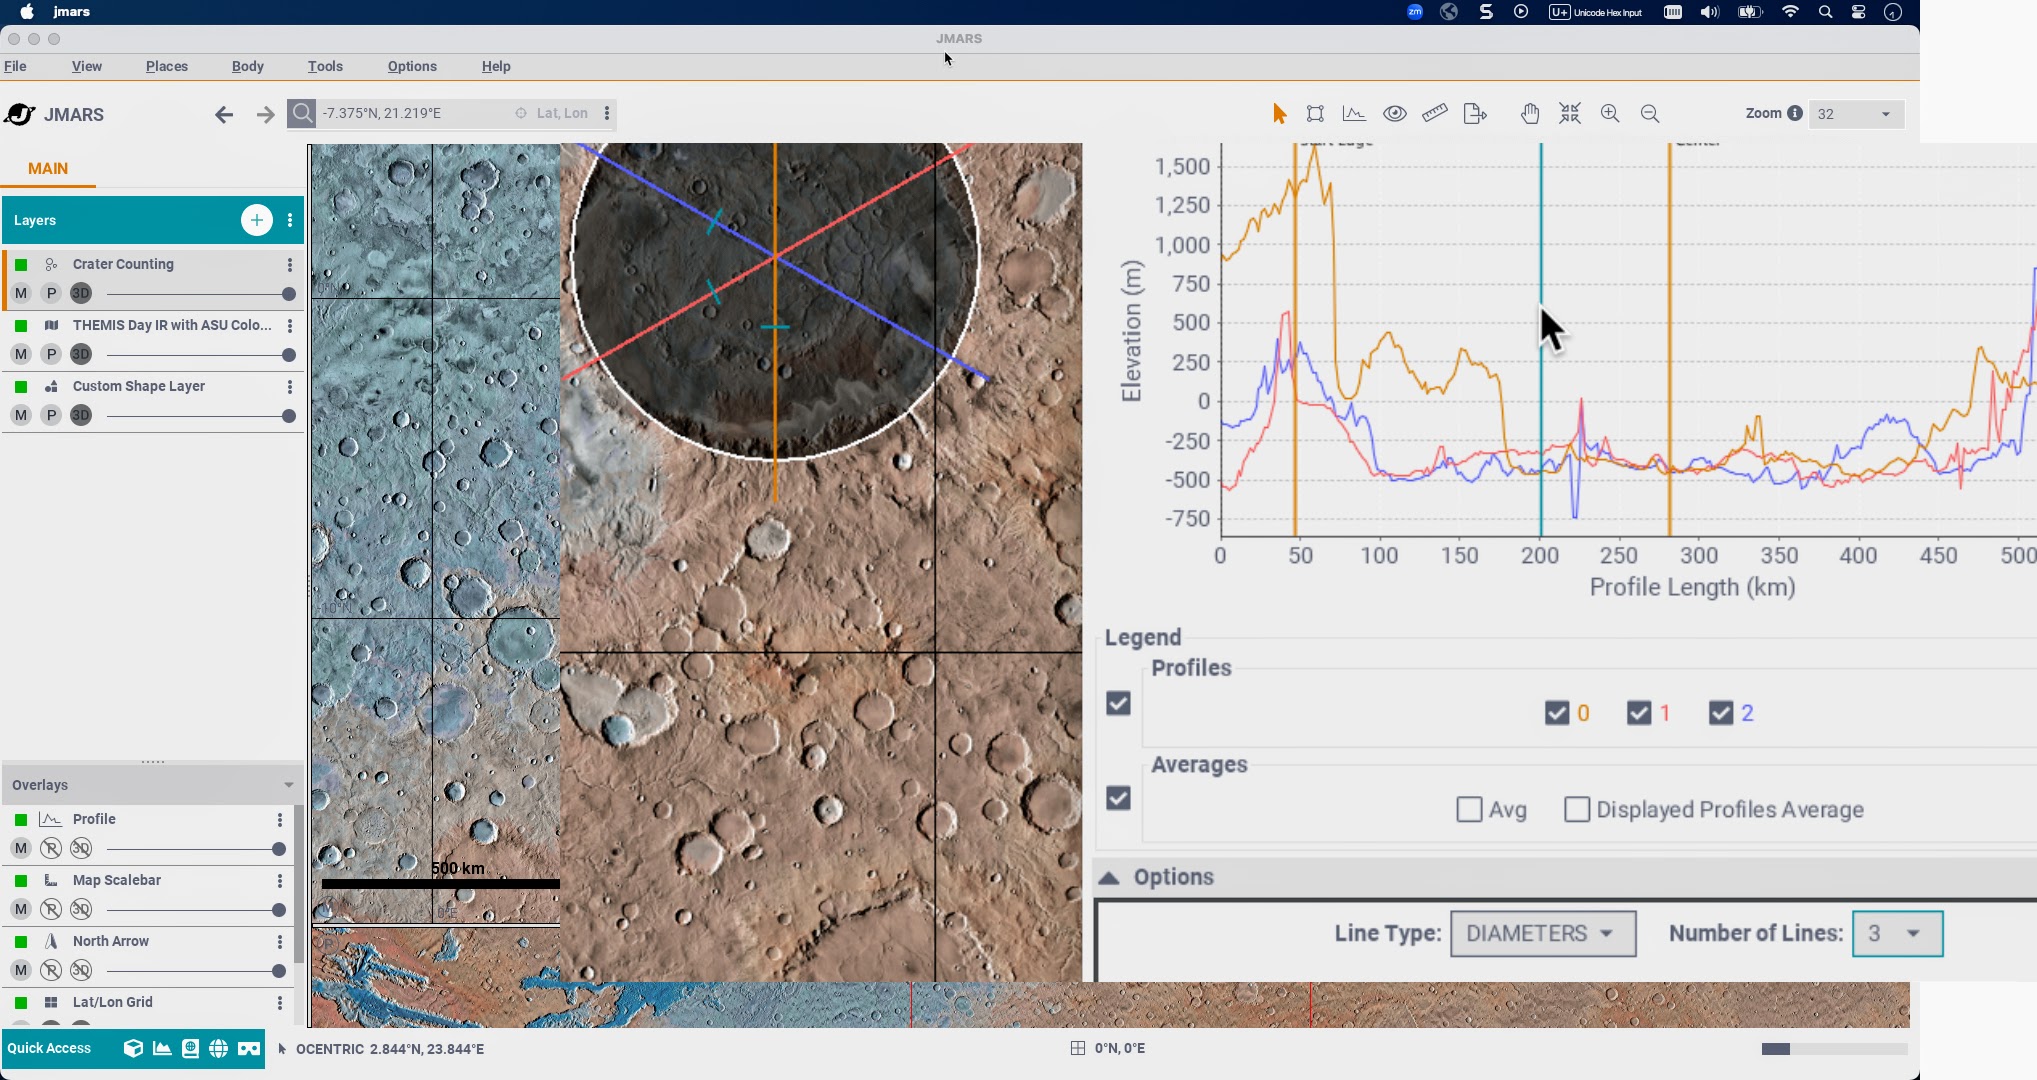
Crater Counting layer – Profile Viewer Upgrades
We've reimagined the experience with powerful new capabilities:
- Streamlined profile selection and custom average viewing
- Implemented interactive crater cues that sync across the chart and Main view
- Added optional edge markers to the chart for better visual clarity
- Improved the UI with new keyboard shortcuts and display options
- Bug fix: Diameter profile lines now render in the correct orientation, matching the user’s perspective as expected
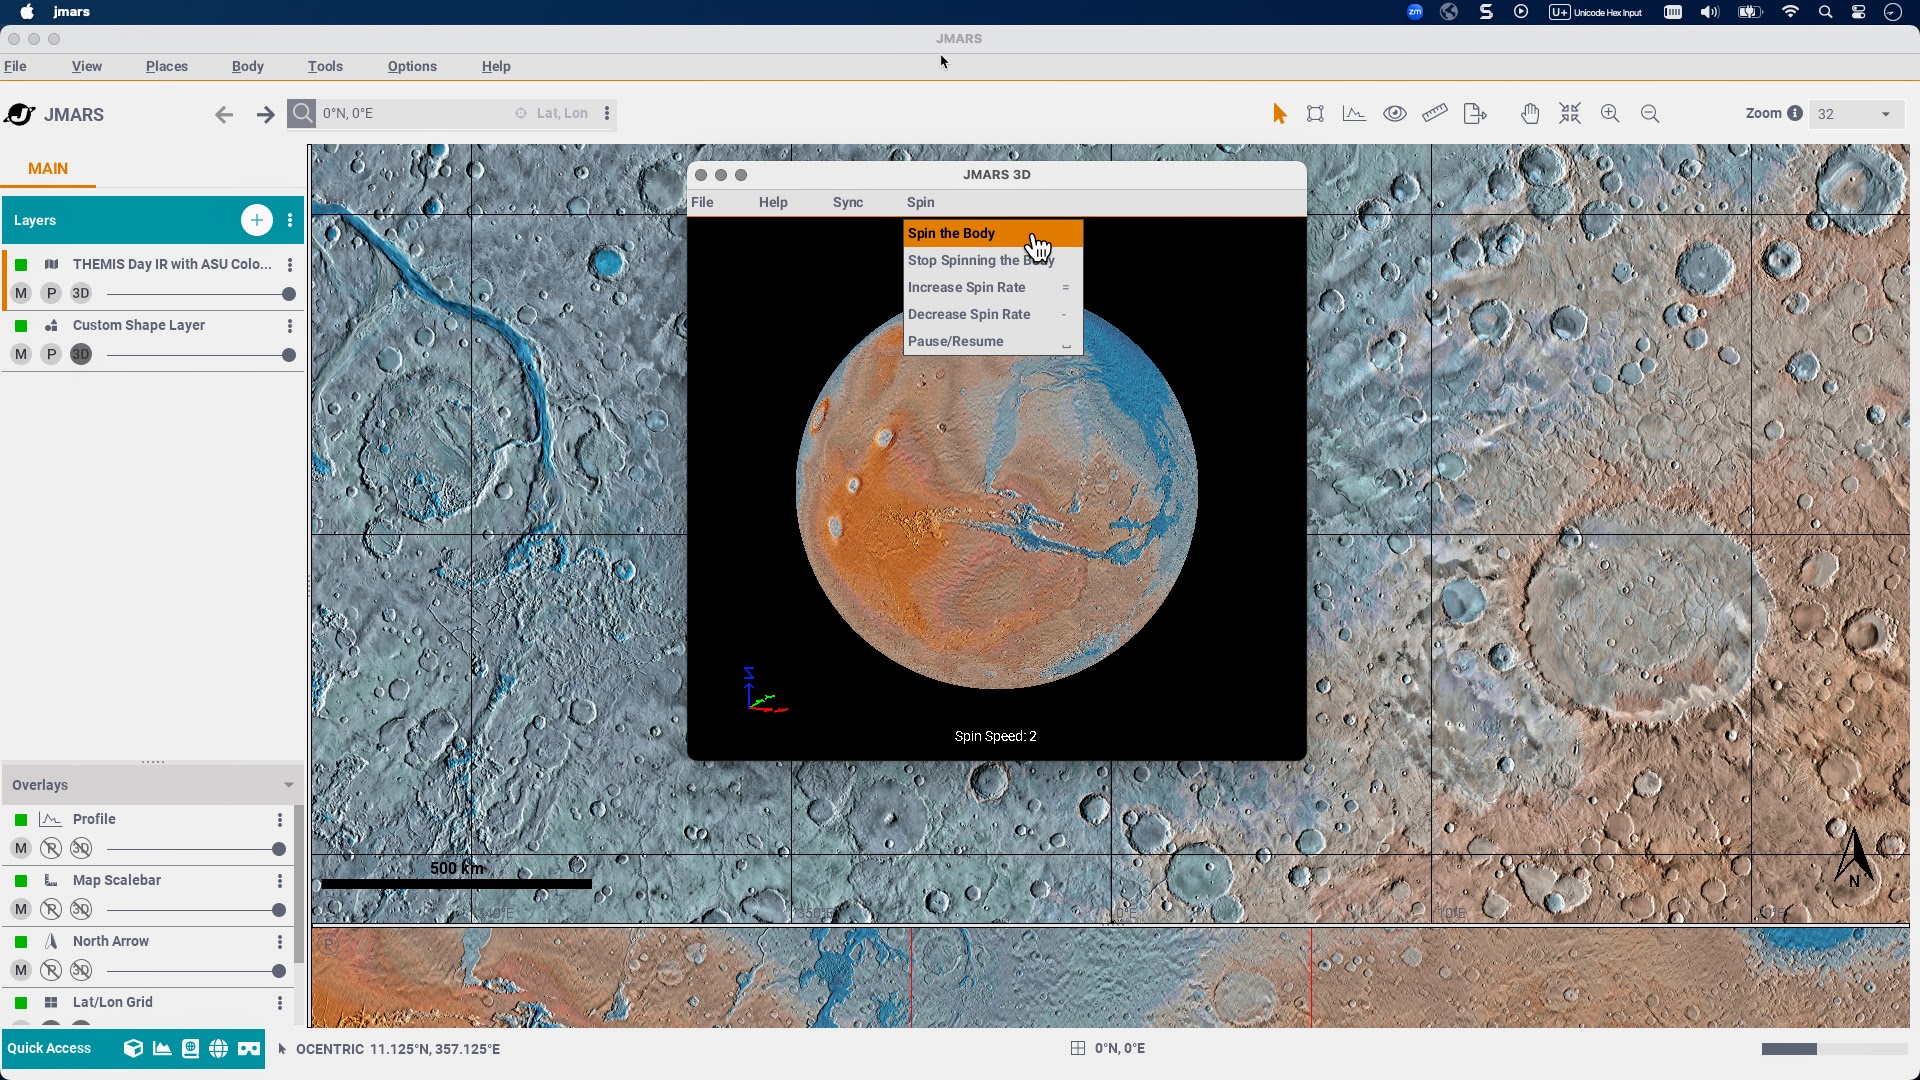
3D Map Spin Mode
You can now rotate the 3D terrain view with ease!
Explore scenes by spinning around the vertical axis—perfect for intuitive navigation and spatial insight.
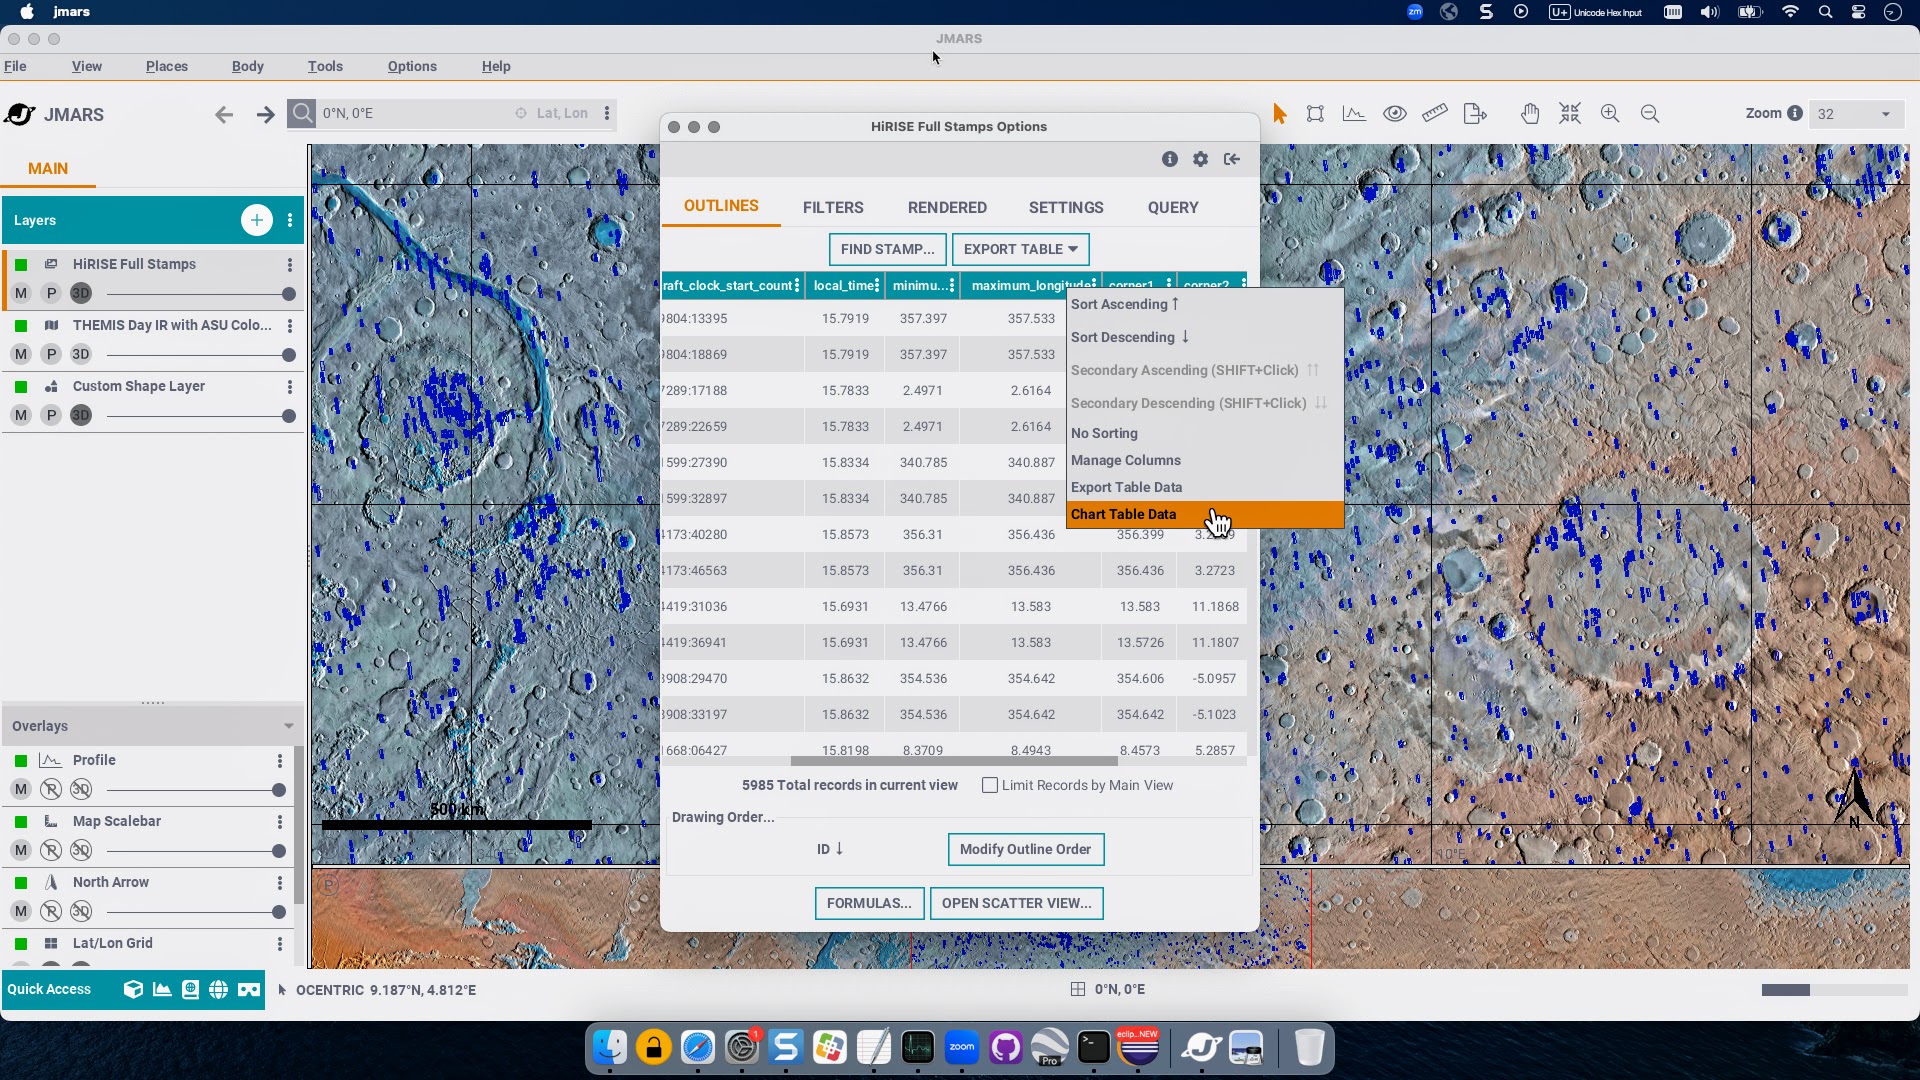
Create Charts from Data Tables
In JMARS tables that feature a three-dot menu in each column header, you can now generate custom charts to visualize and explore your data more effectively
Right-click on the three-dots to bring a menu with the new charting feature—choose your chart type (line, scatter, bar, pie, or histogram), select the data columns to include, and instantly generate custom visualizations.
It’s a fast and flexible way to explore your data more deeply.