
- Home
- Getting Started
- Documentation
- Release Notes
- Tour the Interface
- Tour the Layers
- JMARS Video Tutorials
- Lat/Lon Grid Layer
- Map Scalebar
- Nomenclature
- Crater Counting
- 3D
- Shape Layer
- Mosaics
- Map
- Advanced/Custom Maps
- Graphic/Numeric Maps
- Custom Map Sharing
- Stamp
- THEMIS
- MOC
- Viking
- CRISM Stamp Layer
- CTX
- HiRise
- HiRISE Anaglyph
- HiRISE DTM
- HRSC
- OMEGA
- Region of Interest
- TES
- THEMIS Planning
- Investigate Layer
- Landing Site Layer
- Tutorials
- Video Tutorials
- Displaying the Main View in 3D
- Finding THEMIS Observation Opportunities
- Submitting a THEMIS Region of Interest
- Loading a Custom Map
- Viewing TES Data in JMARS
- Using the Shape Layer
- Shape Layer: Intersect, Merge, and Subtract polygons from each other
- Shape Layer: Ellipse Drawing
- Shape Layer: Selecting a non-default column for circle-radius
- Shape Layer: Selecting a non-default column for fill-color
- Shape Layer: Add a Map Sampling Column
- Shape Layer: Adding a new color column based on the values of a radius column
- Shape Layer: Using Expressions
- Using JMARS for MSIP
- Introduction to SHARAD Radargrams
- Creating Numeric Maps
- Proxy/Firewall
- JMARS Shortcut Keys
- JMARS Data Submission
- FAQ
- Open Source
- References
- Social Media
- Podcasts/Demos
- Download JMARS
Delivery 3
Delivery 3 - TAT 26.08.0
This release adds Point-of-View Mode, enhanced event tooltips and navigation, pointing constraint checks, Day of Year time formatting, and several display and interface improvements. The sections below describe each new feature, where to find it, and how to use it.
Before You Begin: Update JMARS to ensure that you are using the latest release and have access to all Delivery 3 features.
Updated JMARS Delivery Title
The JMARS application title has been updated to identify the current delivery.
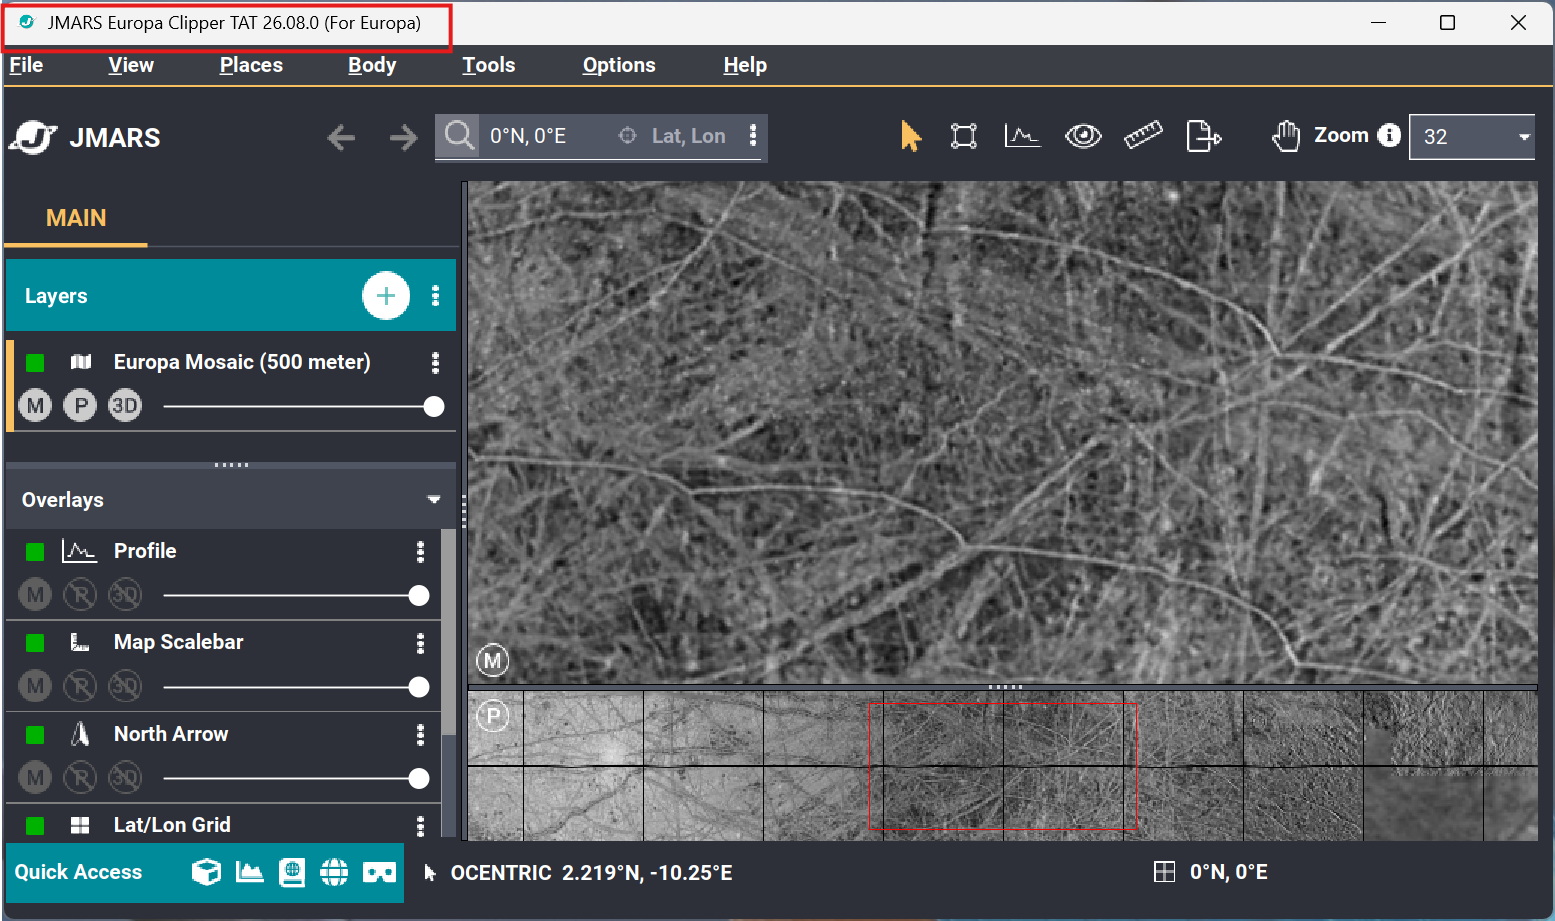
The JMARS title identifies the current delivery release.
Add the Clipper Pointing Validation Layer
- In the Layer Manager, click the + button to open the Add Layer menu. Locate and select the Clipper Pointing Validation layer.
- When the Clipper Validation Planning dialog opens, select the appropriate options. This tutorial uses the latest kernel set and Orbit 8.
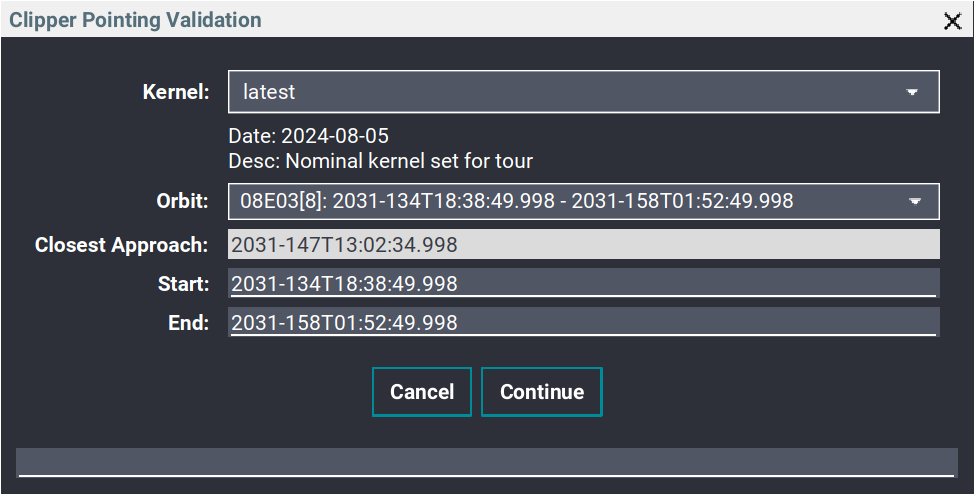
Select the latest kernel set and Orbit 8 for this tutorial.
- Wait for the Clipper Pointing Validation layer to finish loading in the Layer Manager.
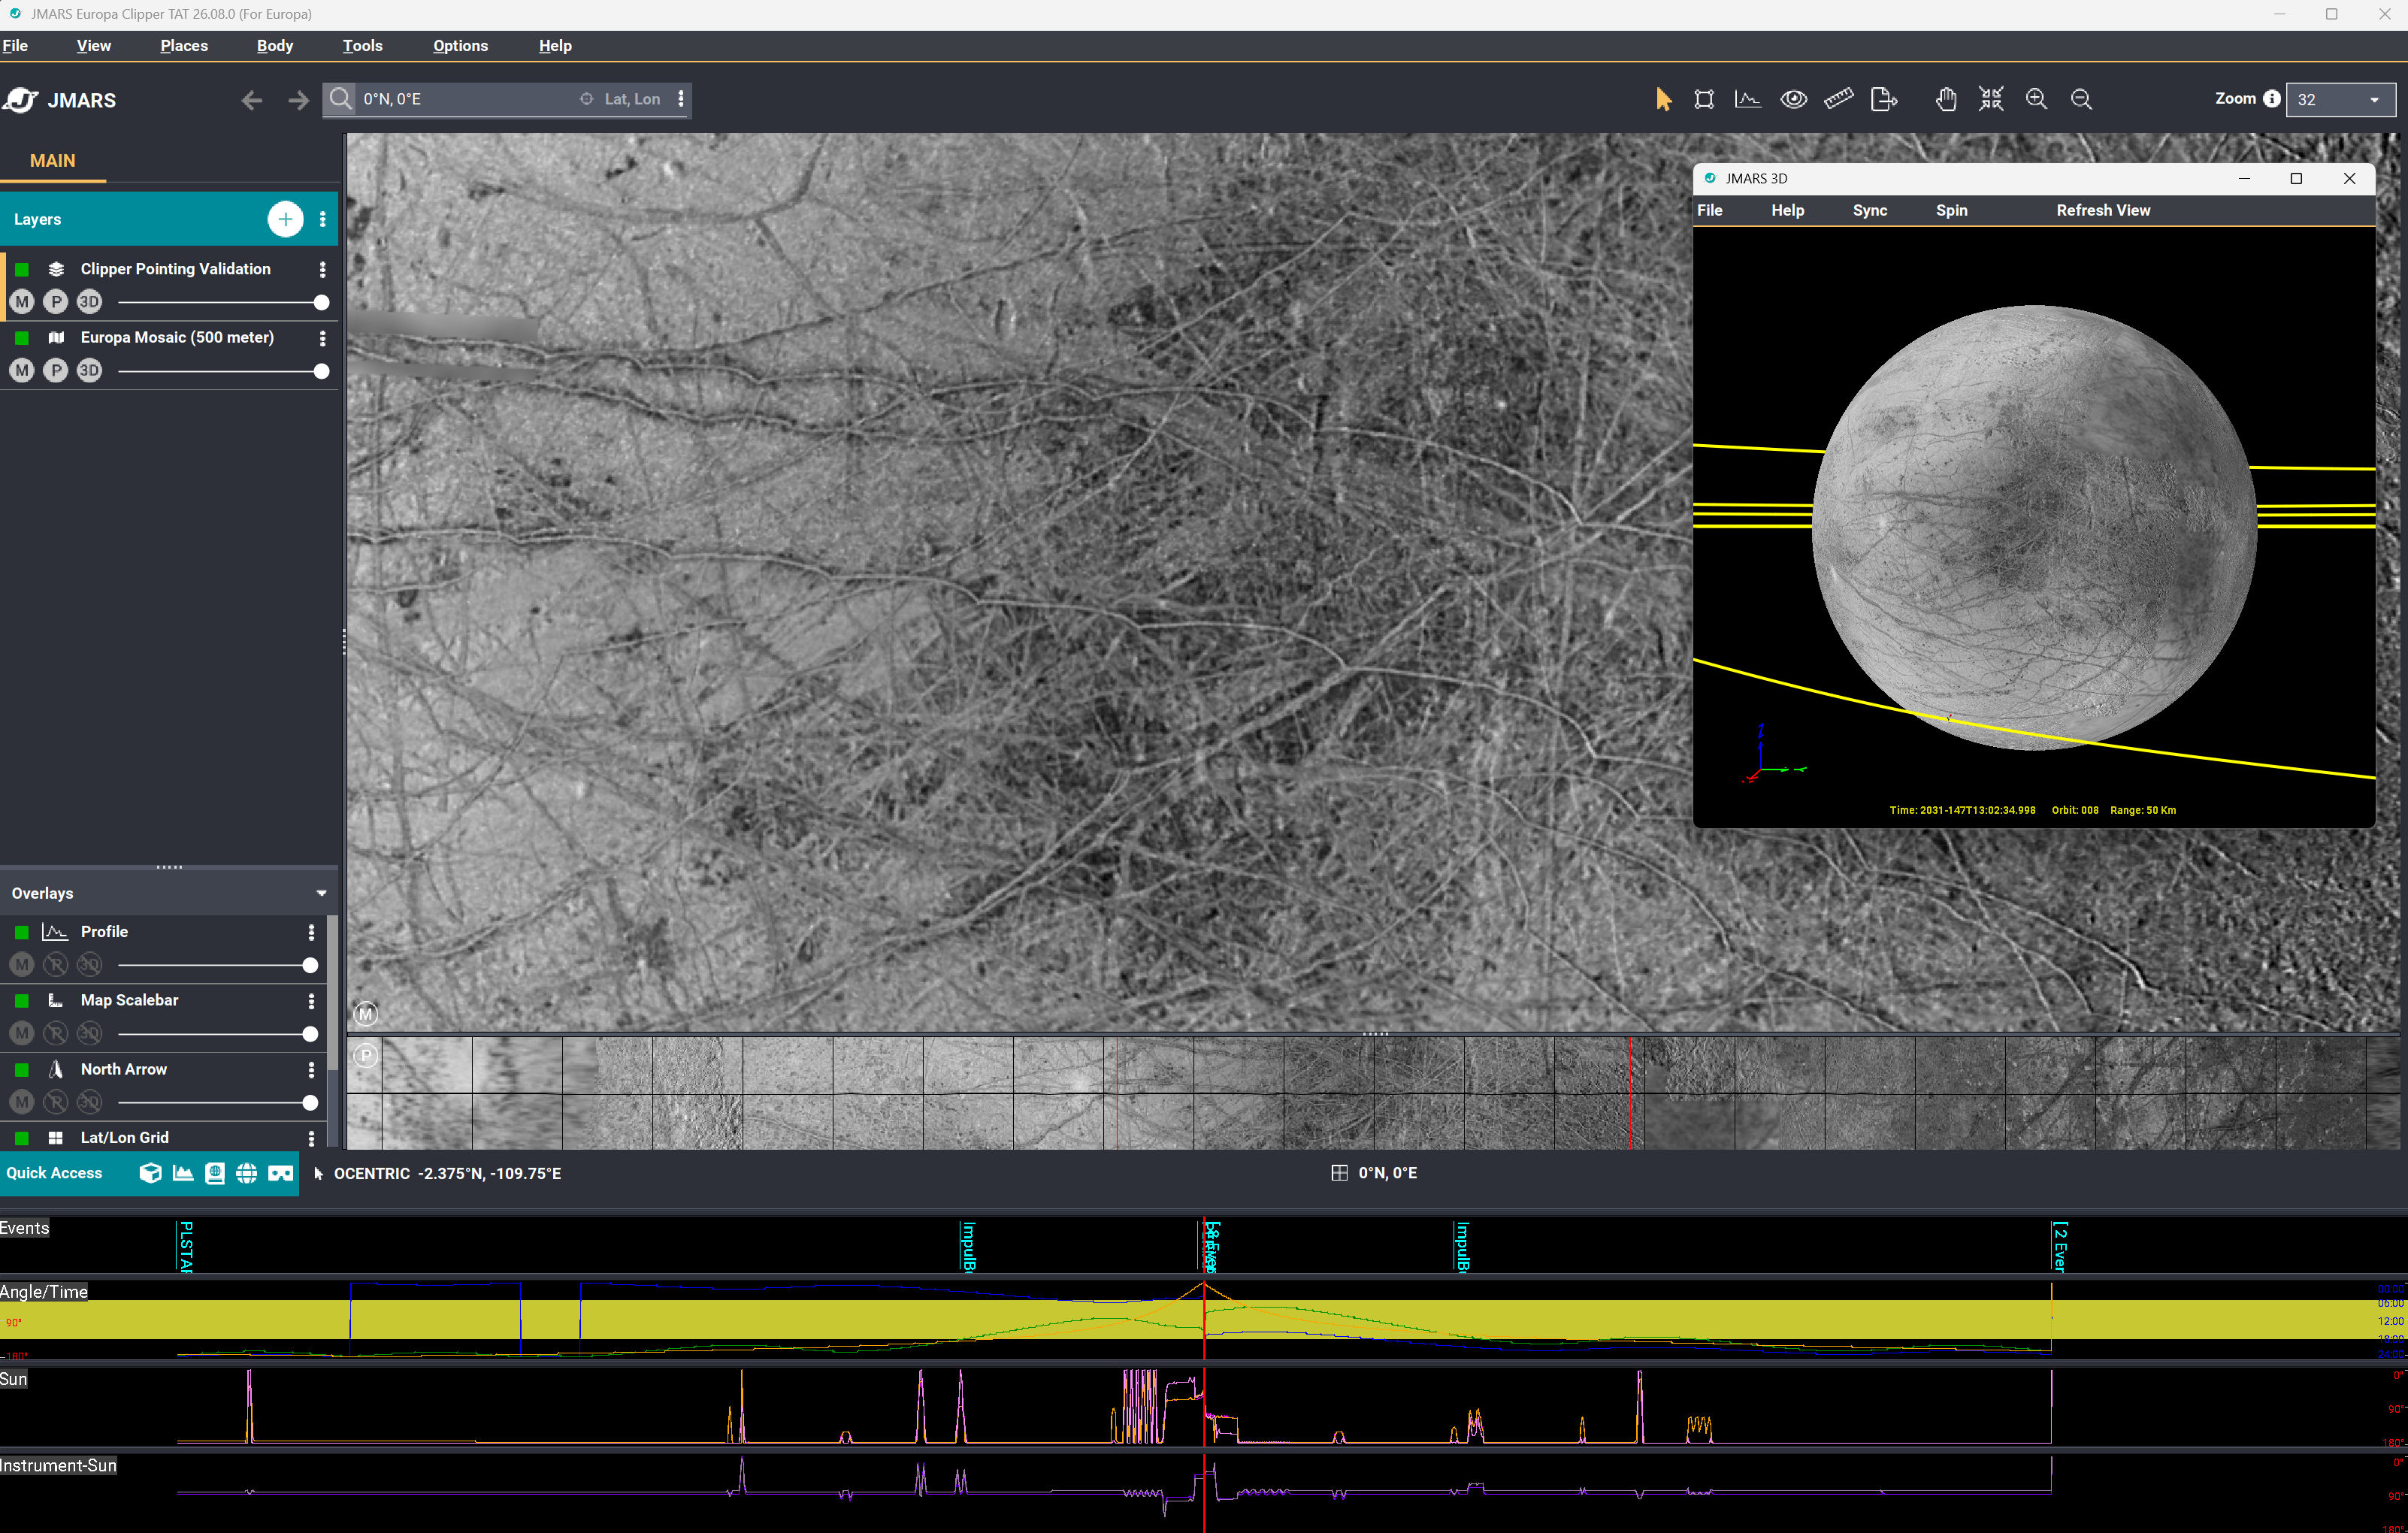
The Clipper Pointing Validation layer loaded in the Layer Manager.
Point-of-View Mode
Point-of-View Mode changes the 3D view to show the scene from the spacecraft's perspective. The view can then be adjusted using horizontal and vertical offsets.
- Double-click the Clipper Pointing Validation layer to open the layer options window.
- In the Time tab of the focus panel, change the Current time to the time you want to view. This example uses 2031-147T13:39:14.998.
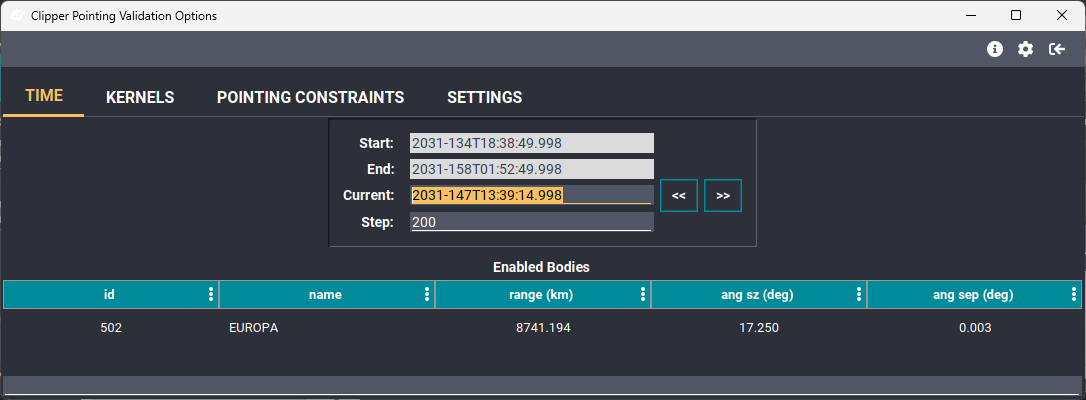
Change the Current time in the Time tab before enabling Point-of-View Mode.
- Select the Settings tab and locate Point-of-View Mode under 3D Options. The 3D view initially displays the standard view with Point-of-View Mode disabled.
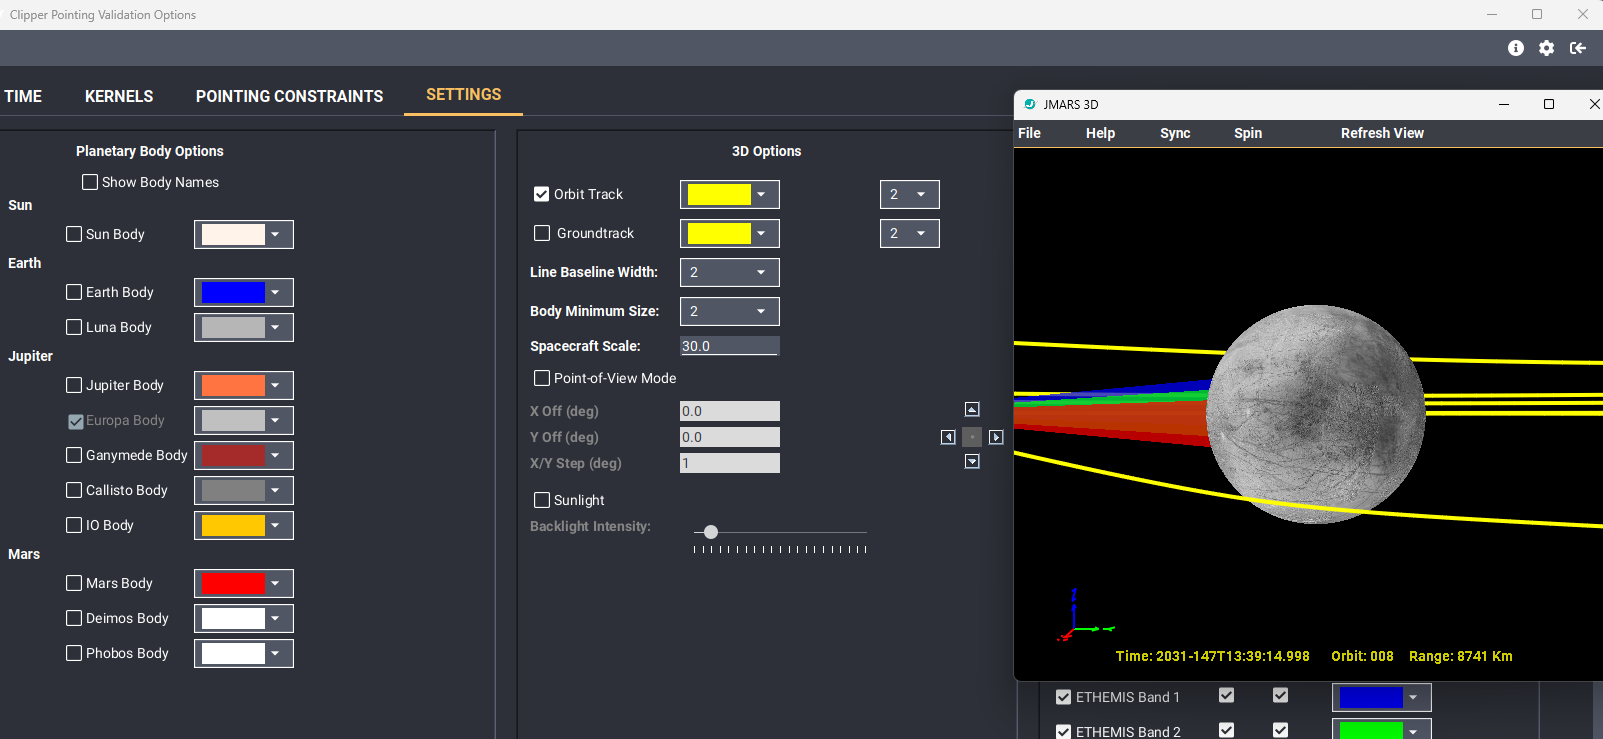
The Settings tab and 3D view before Point-of-View Mode is enabled.
- Select the Point-of-View Mode checkbox to enable the controls and change the 3D view to the spacecraft's perspective.
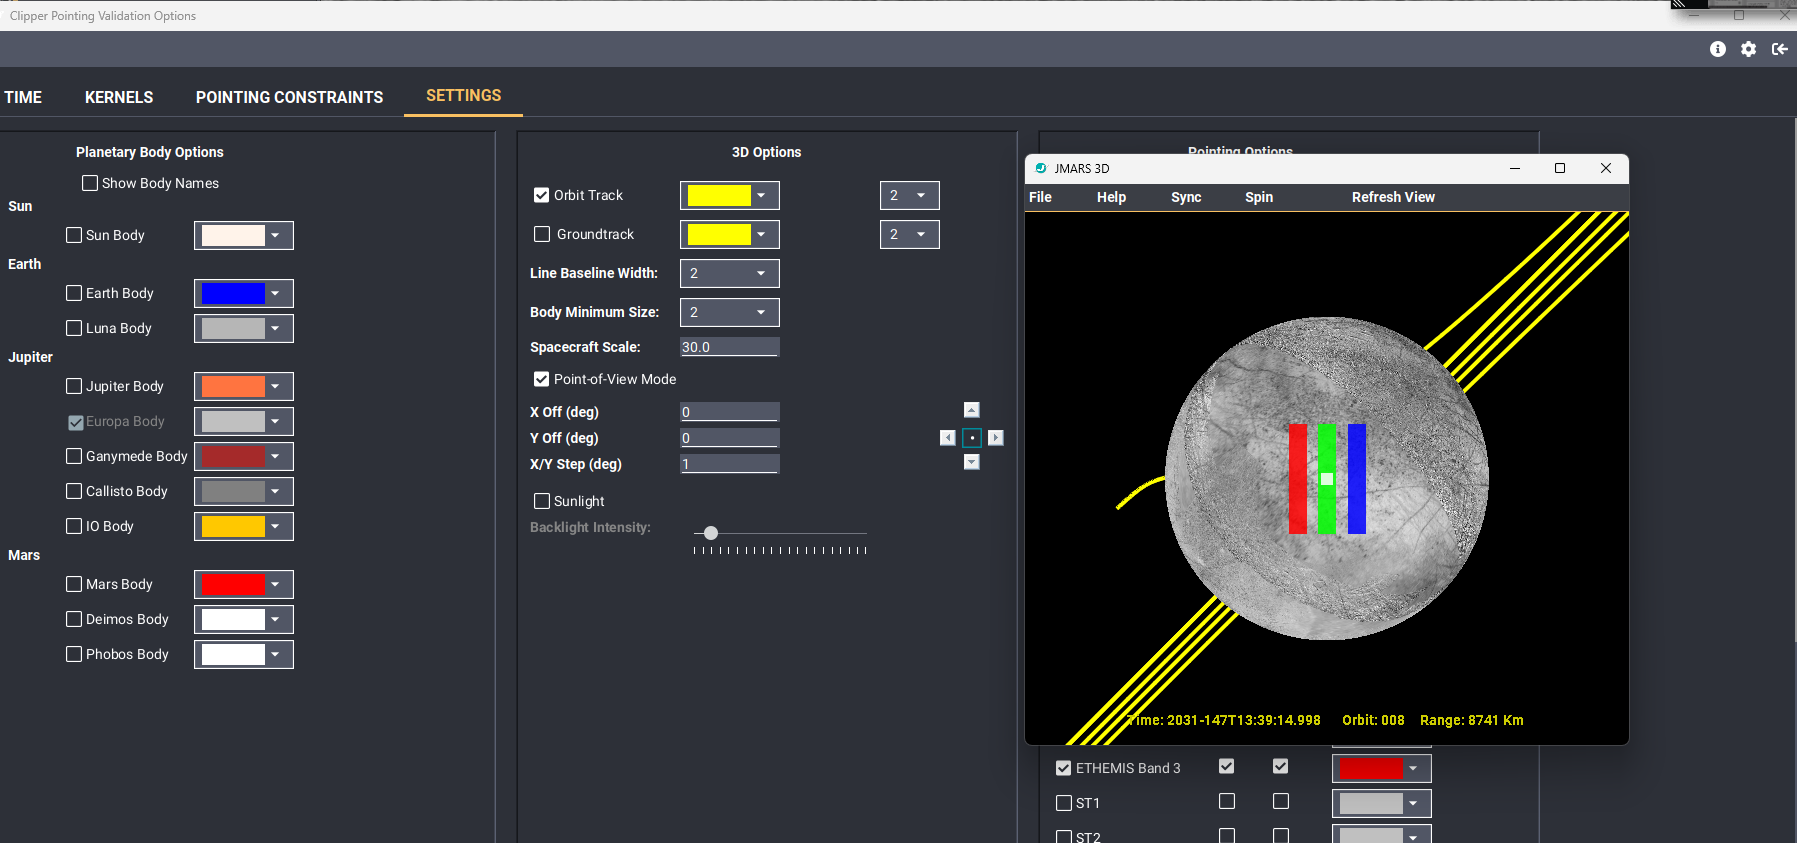
Point-of-View Mode enabled with the default X and Y offset values.
The left and right arrows adjust the X offset, while the up and down arrows adjust the Y offset. The X/Y Step (deg) value determines how far the view moves with each click. Select the middle button, shown as a dot, to reset the offsets to their default values.
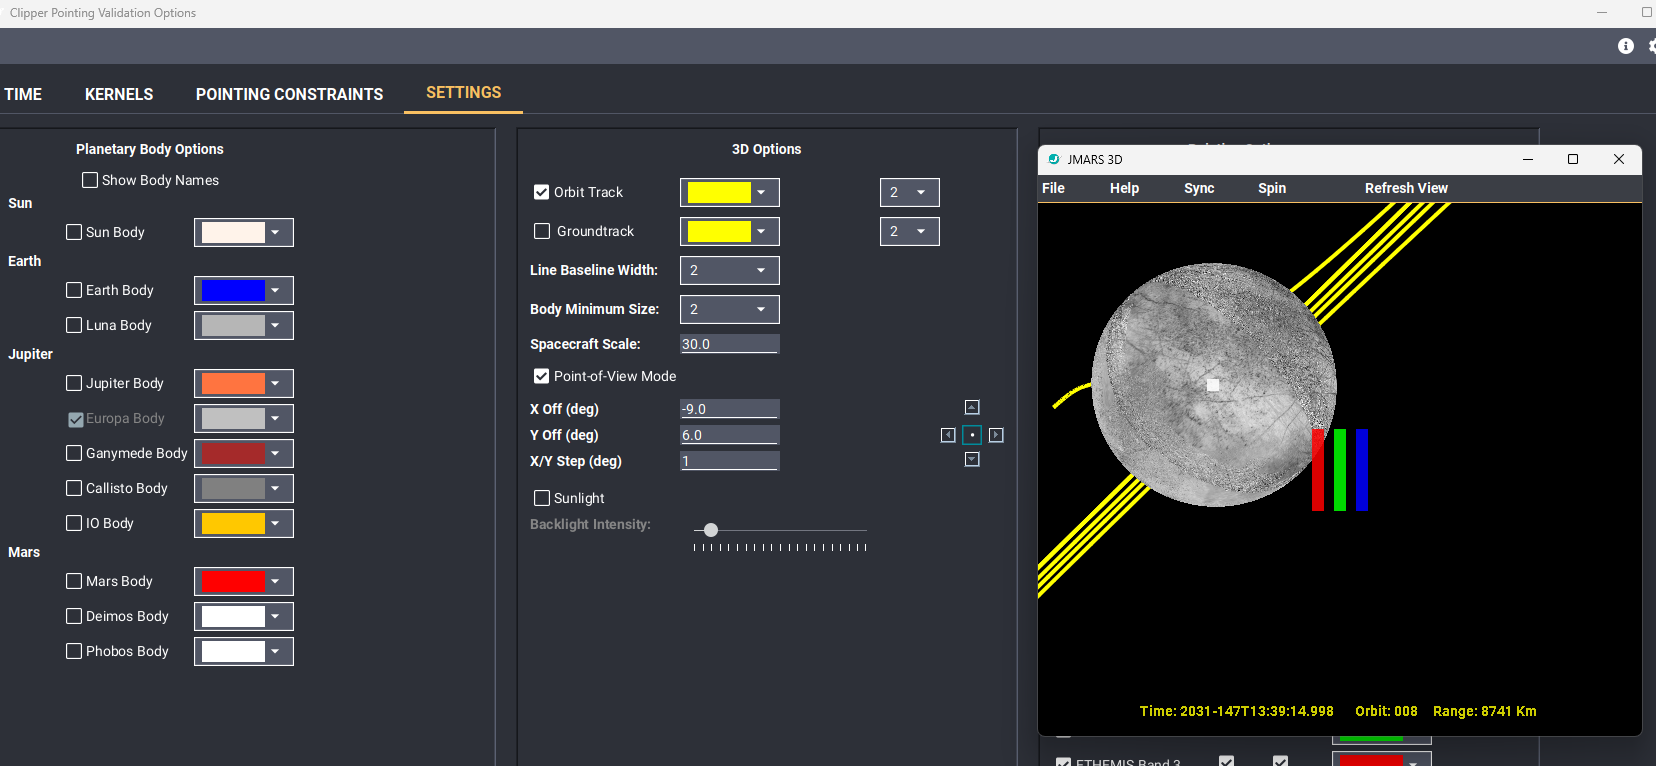
The Point-of-View has moved after the X and Y offsets are adjusted.
Event Ruler Tooltip Enhancements
The Events ruler now groups overlapping events and displays the number of events associated with that time.
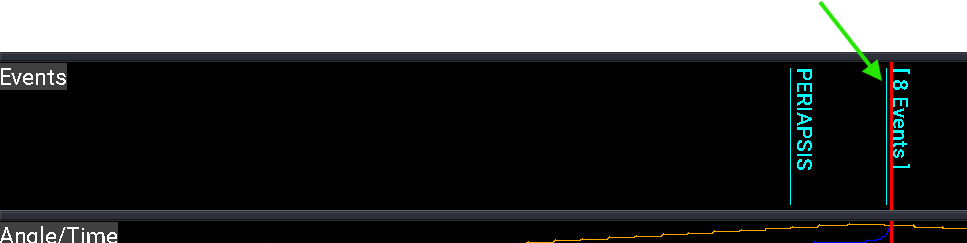
The Events ruler indicates that eight events occur at the highlighted time.
Place the mouse cursor over the grouped events. In this example, hovering over 8 events displays a tooltip listing the associated events.
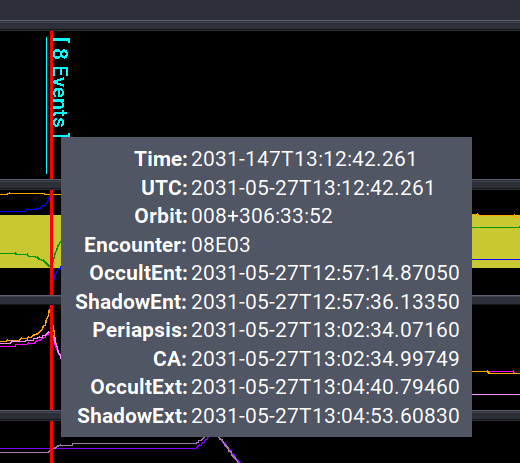
Hover over the grouped event label to display the associated events.
Event tooltips also indicate whether the mouse cursor is inside or outside the planned time range. When the mouse cursor is within the planned time range, the tooltip displays the events associated with that time. When the mouse cursor is outside the start or end time of the plan, the tooltip displays Outside plan range.
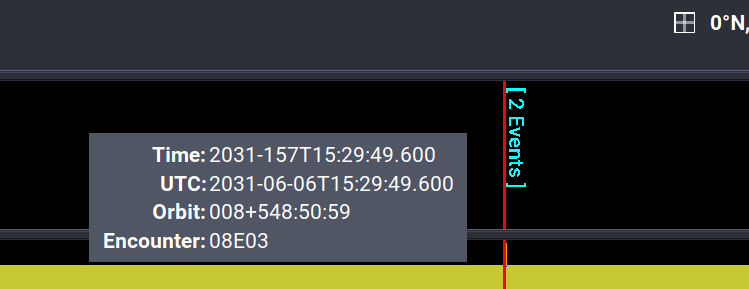
When the cursor is inside the planned time range, the tooltip displays the associated events.
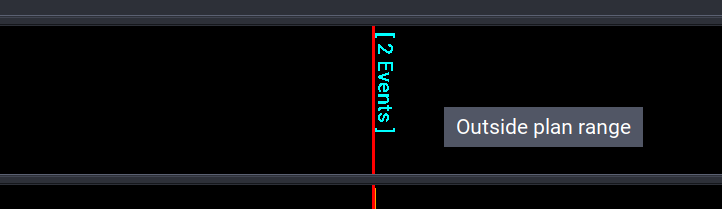
When the cursor is outside the planned time range, the tooltip displays Outside plan range.
If the Events ruler has been moved away from the events and they are no longer visible, red arrows appear in the ruler. The arrows indicate the direction in which the user should navigate to locate the events.
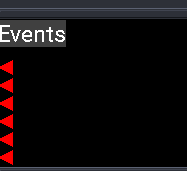
Red arrows indicate the direction of events outside the visible ruler area.
Event Ruler Jump Navigation
- Right-click in the Events ruler.
- Select Jump Ruler Center, and then select Jump Menu... to open the Time Ruler Navigator dialog.
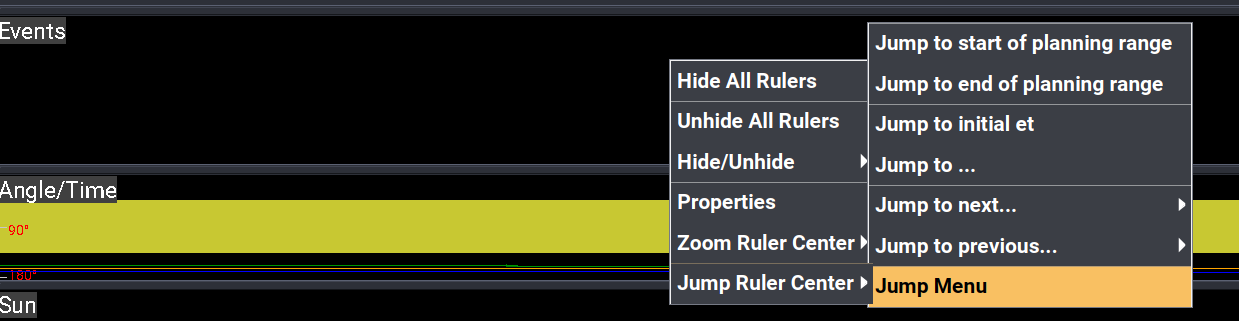
Open the Jump menu from the Events ruler context menu.
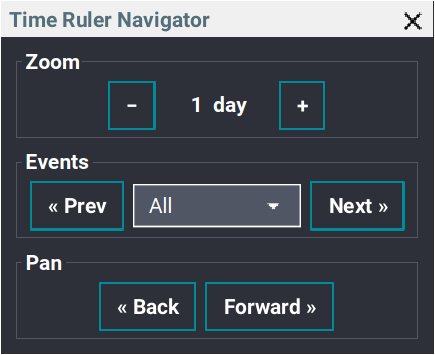
The Time Ruler Navigator dialog.
Change the Zoom Level
Use the plus and minus controls in the Zoom area to increase or decrease the timeline zoom level.
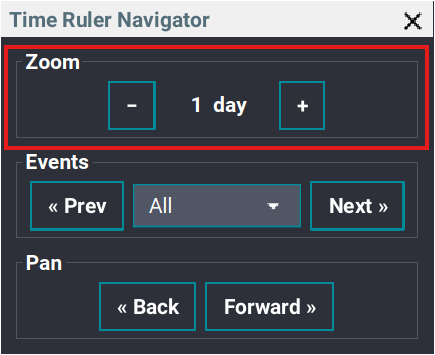
The highlighted Zoom area contains the minus and plus controls used to change the timeline zoom level.
Example: The following images show the ruler before and after the zoom level is changed from one day to 21 days.

Before zooming out, the rulers display a one-day time range.

After zooming out, the rulers display a 21-day time range.
Jump Between Events
The Events section allows users to jump from one event to another. Open the drop-down list and select a specific event to move the timeline to that event.
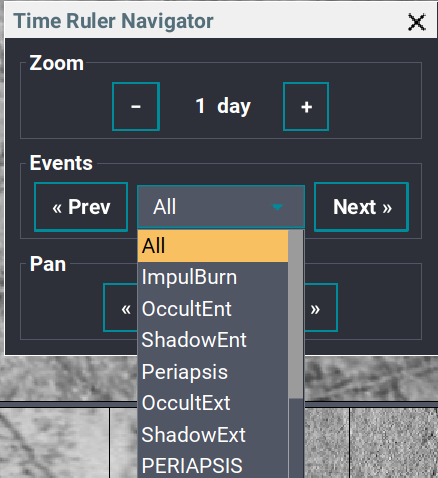
The highlighted Events area allows users to select an event type and jump to the previous or next matching event.
Example: The following images show the ruler before and after Next is selected to jump to the next event.

Before the jump, select Next to move to the next event in the ruler.

The ruler center moves to the next event.
Pan the Timeline
Use the controls in the Pan area to move the timeline to the left or right in smaller increments. This allows the user to make more precise adjustments to the displayed time range.
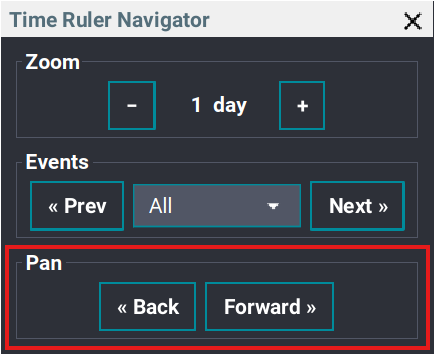
The highlighted Pan area contains the Back and Forward controls used to move the timeline in smaller increments.
Example: The following images show the ruler before and after Forward is selected in the Pan area.
The ruler position before using the Forward Pan control.

The ruler moves forward by a smaller increment when Forward is selected in the Pan area.
Pointing Constraints
Delivery 3 adds a Pointing Constraints tab to the Pointing Validation Layer focus panel. This tab allows users to run constraint checks and review any violations that are found.
- Double-click the Clipper Pointing Validation layer in the Layer Manager to open the layer options window.
- Select the Pointing Constraints tab.
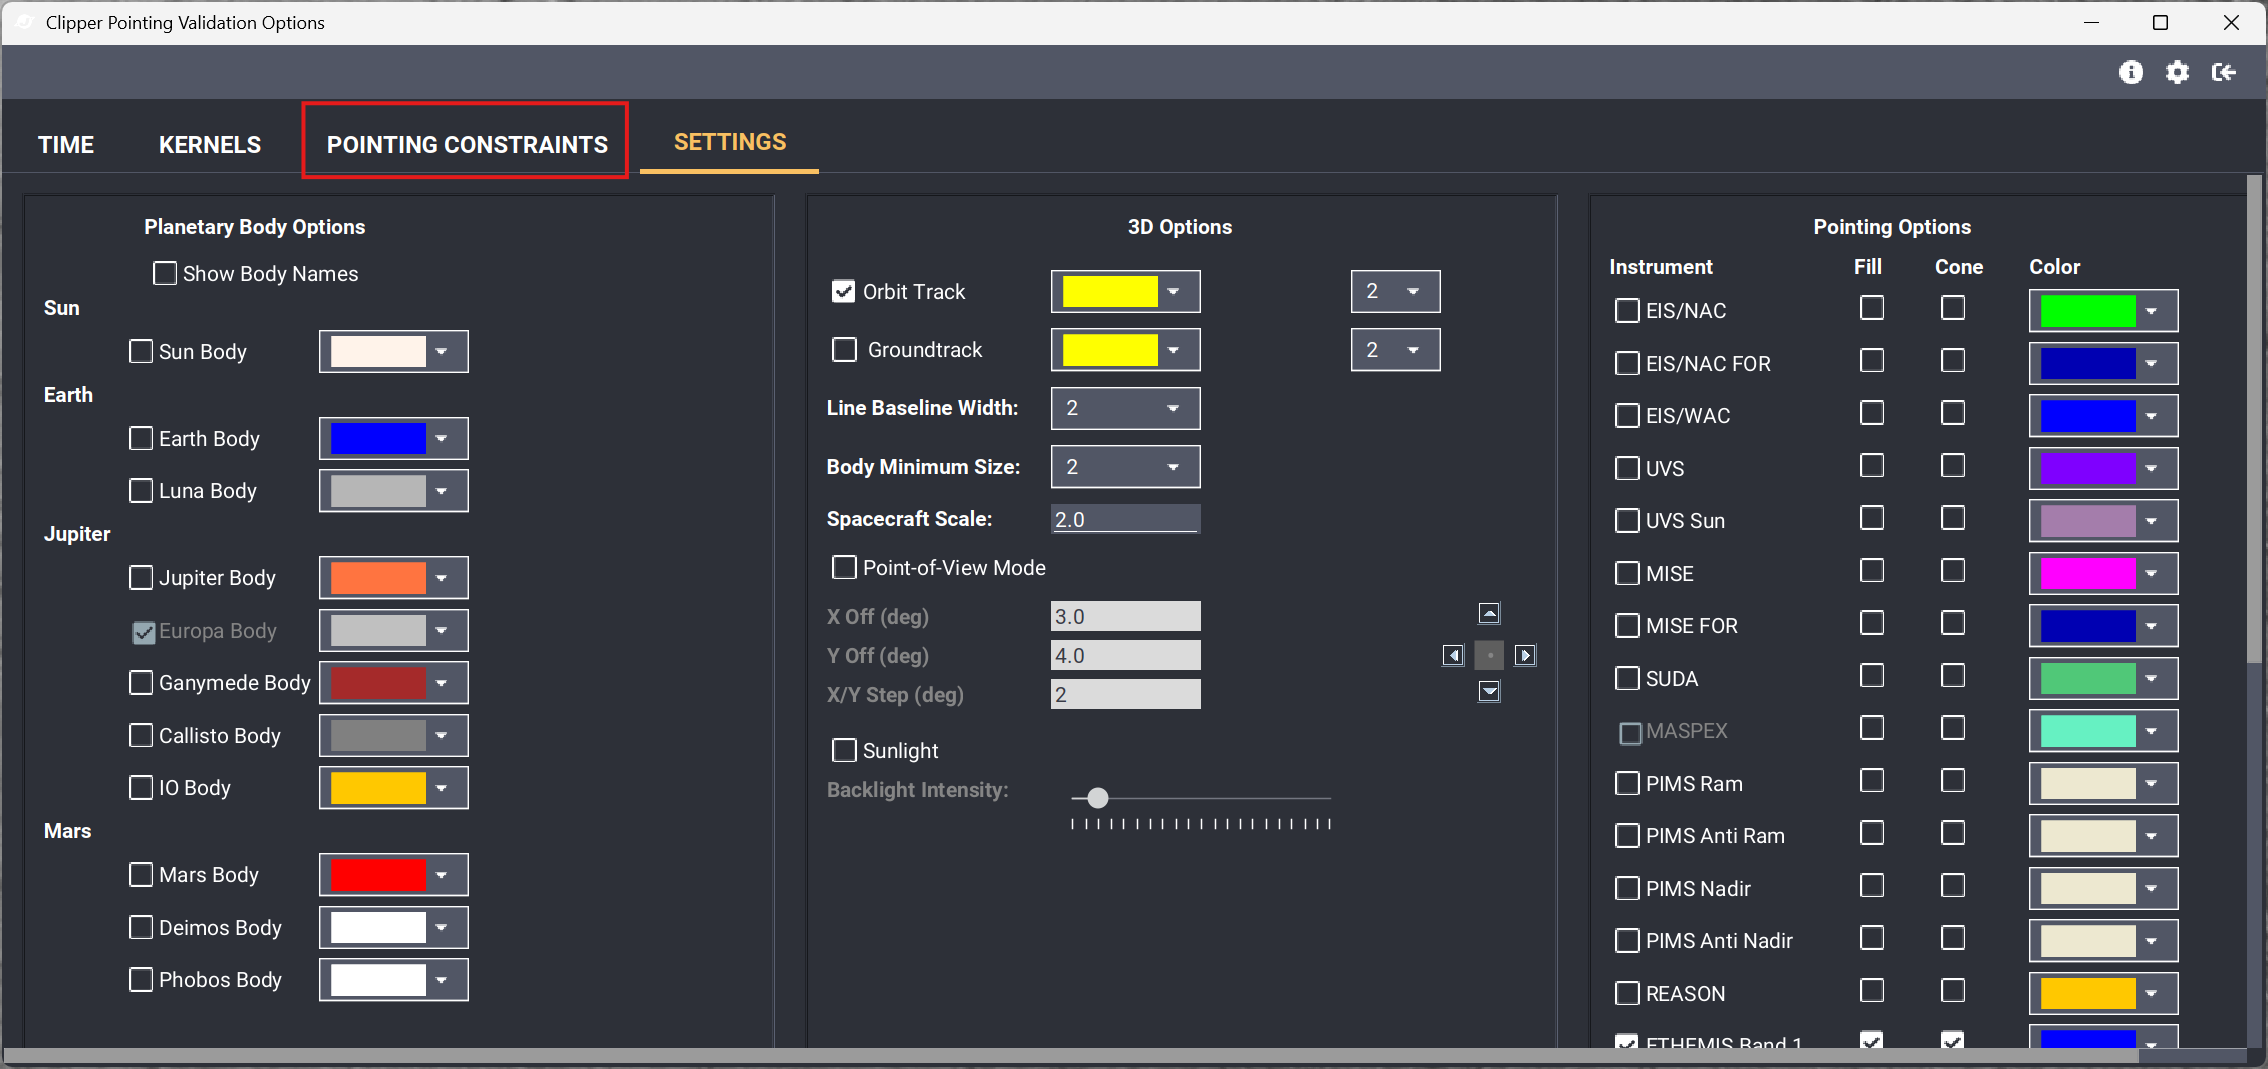
Select the Pointing Constraints tab in the layer options window.
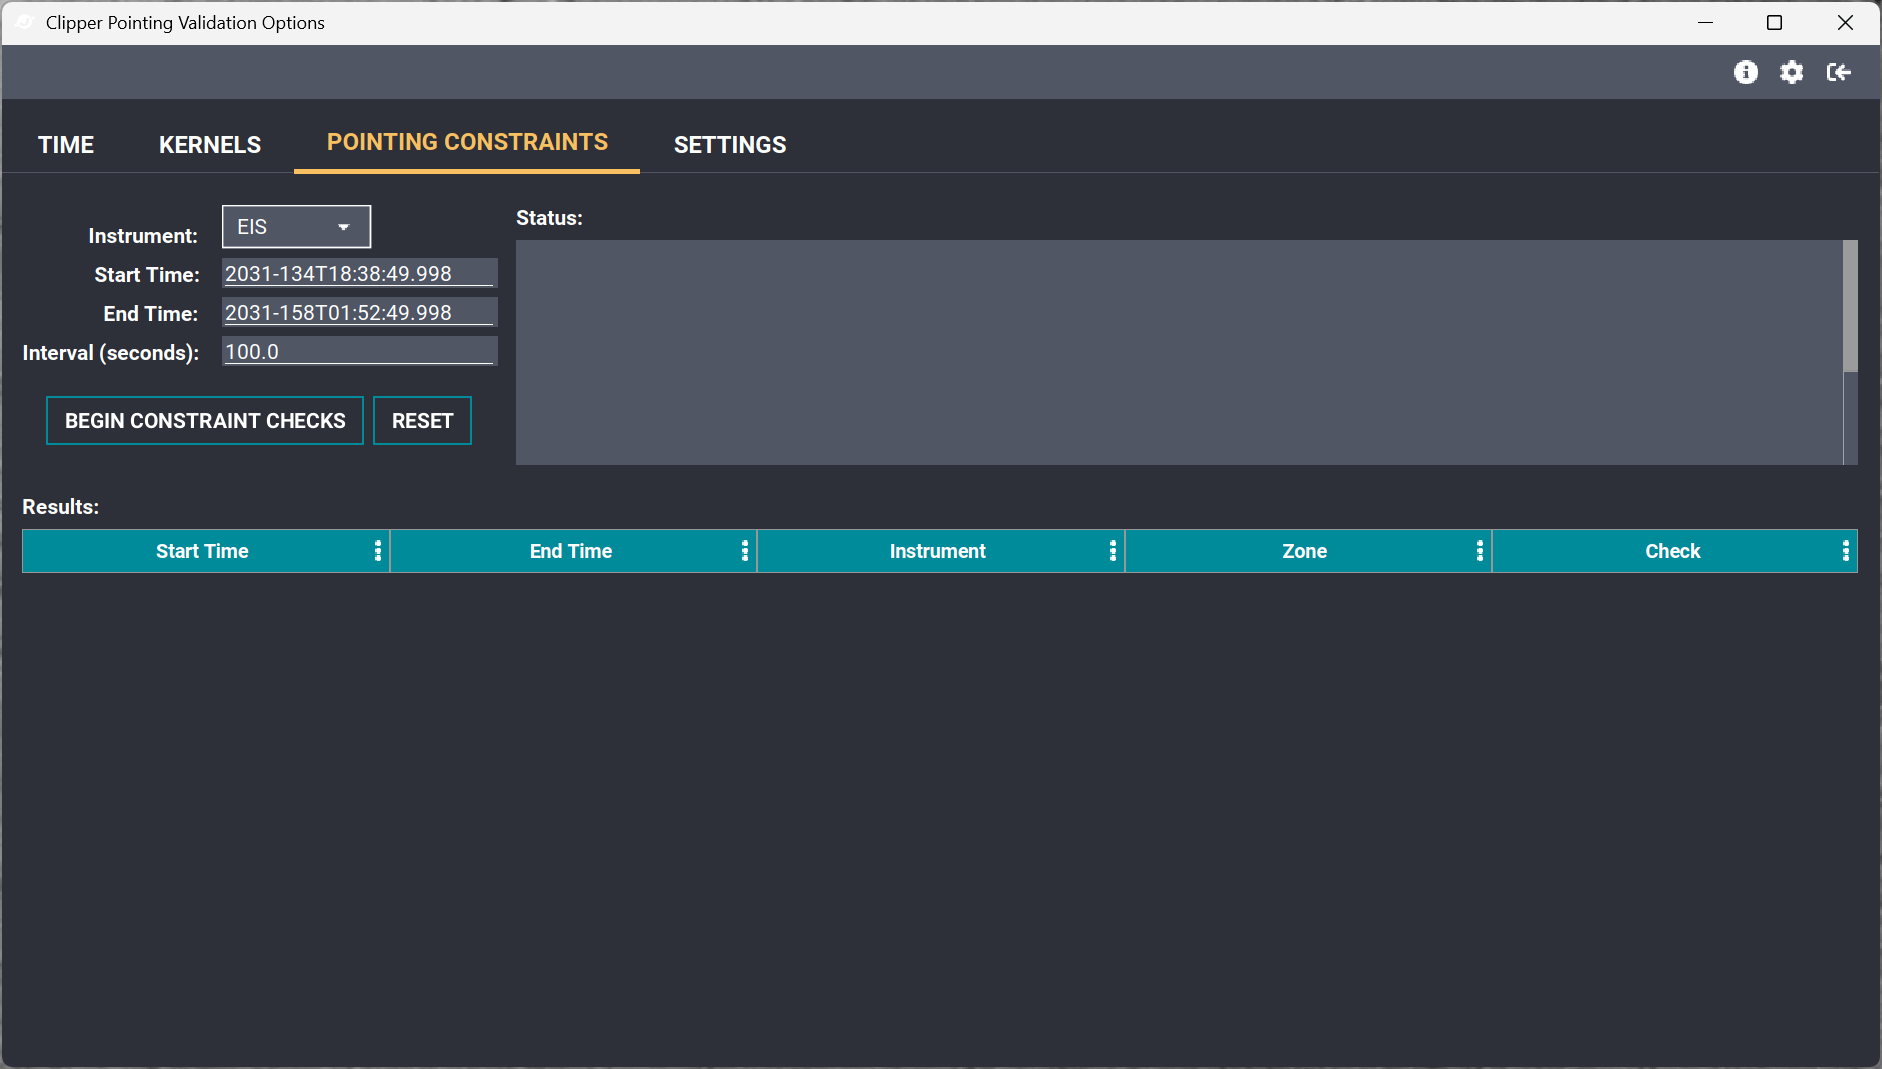
The Pointing Constraints tab before a constraint check is run.
Configure the Constraint Check
Constraint checks can be run using the default selection to check multiple instruments, or a specific instrument can be selected.
About Constraint Checks: The Pointing Constraints tool checks instrument fields of view (FOVs) and keep-out zones (KOZs) for stray-light incursions. It currently supports EIS-WAC, EIS-NAC, E-THEMIS, UVS, MISE, SUDA, SRU1, and SRU2. Depending on the selected instrument, the checks evaluate whether the Sun or Jupiter enters an instrument's FOV or KOZ. Any gaps in SPICE data that prevent a check from being performed are reported in the results table along with the detected constraint violations.
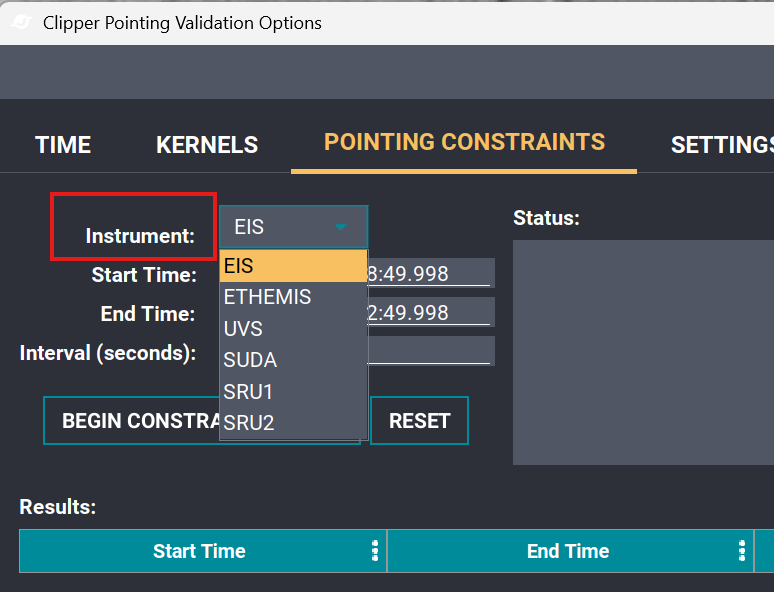
Select the instruments to include in the constraint check.
The start and end times default to the start and end of the plan. Both values can be changed manually.
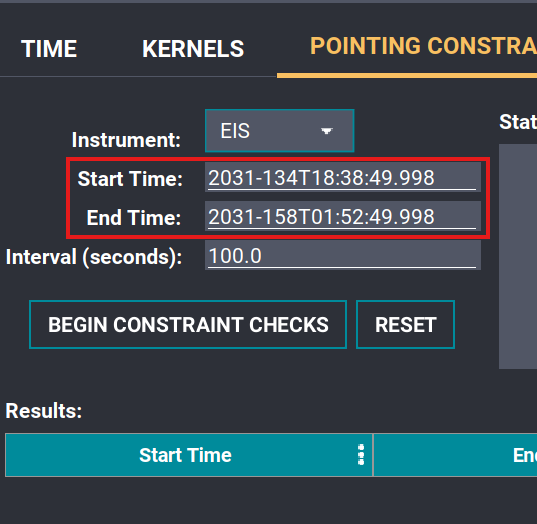
The start and end times default to the planned time range and can be altered manually.
The Interval (seconds) value defaults to 100.0 seconds and can also be changed manually. If any settings have been changed, select Reset to restore the default values.
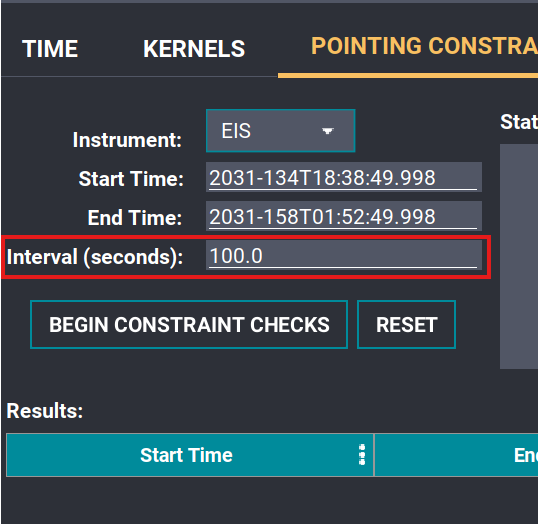
The constraint-checking interval defaults to 100.0 seconds.
Run the Constraint Check
- Select Begin Constraint Checks.
- Review the Status area for a summary of the checks performed and the violations found.
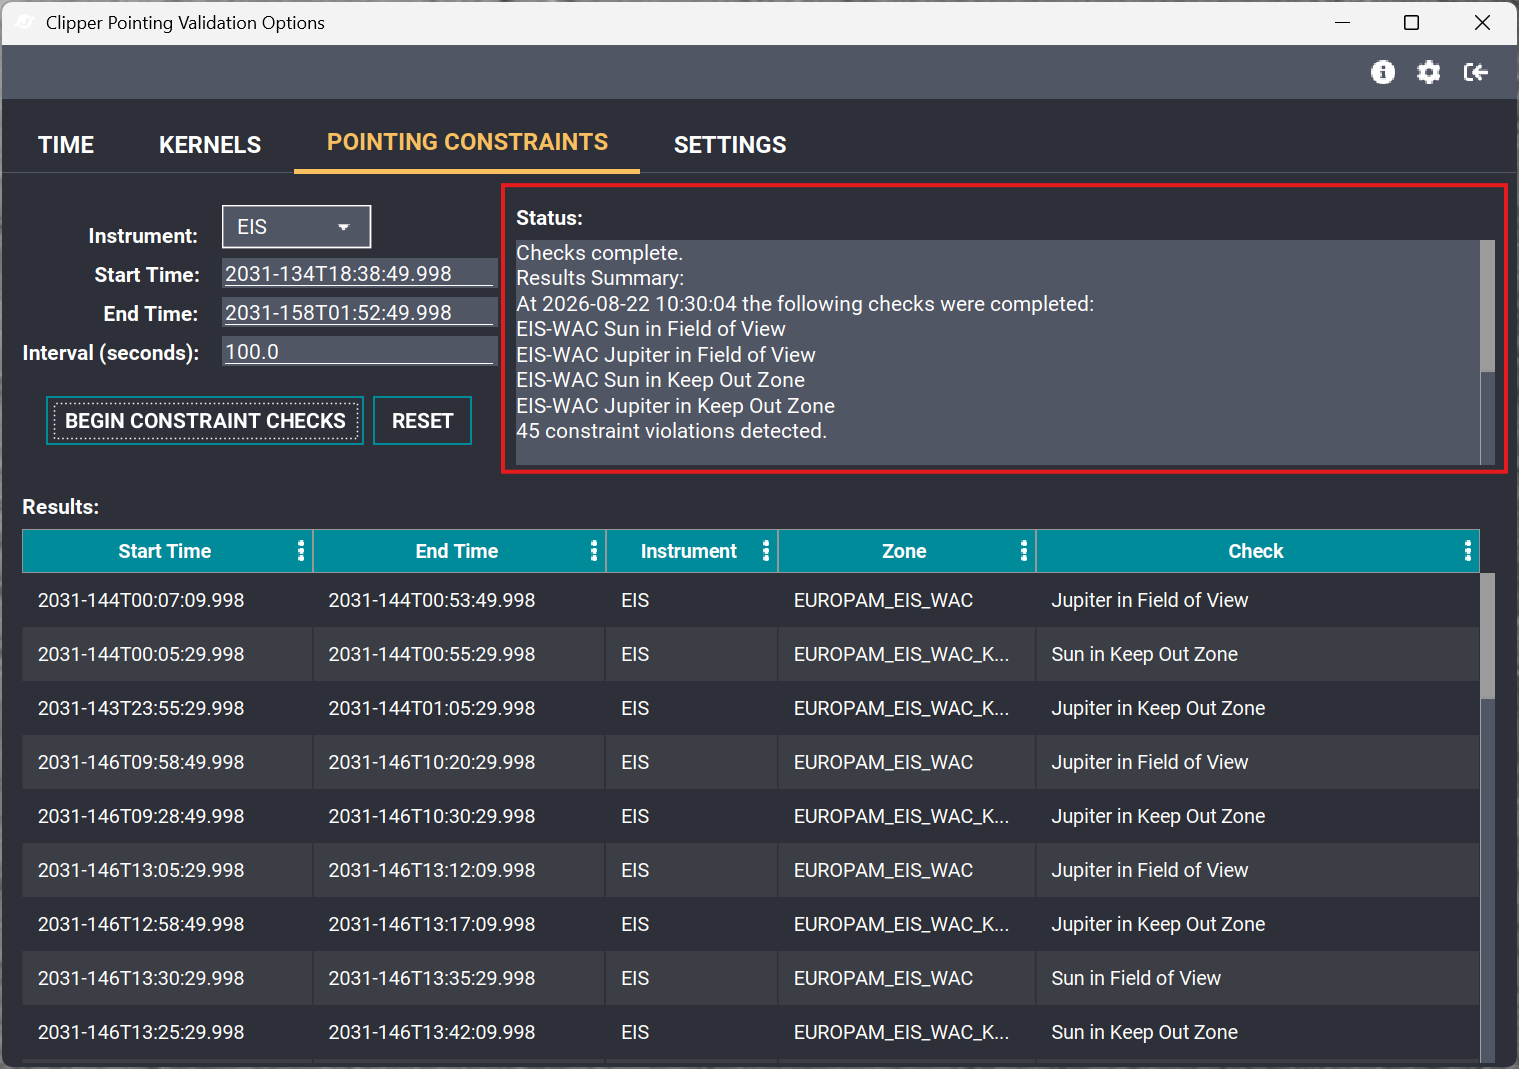
The Status area summarizes the checks performed and the violations found.
The results table provides a summary of the violations found during the check.
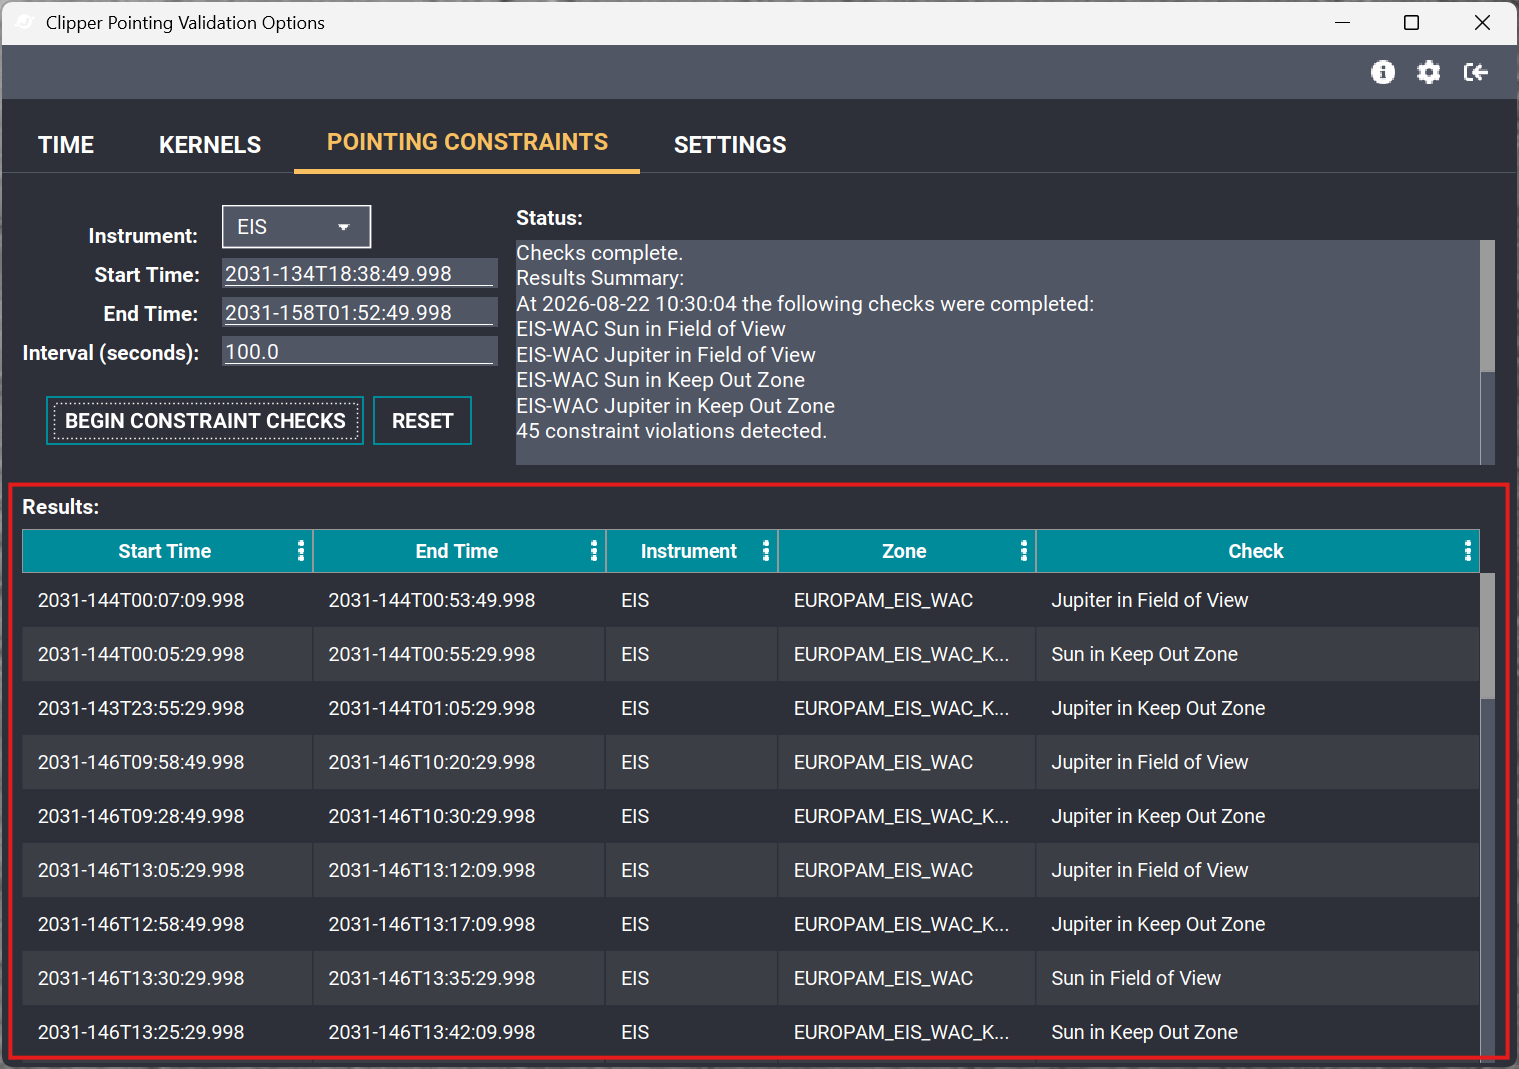
The results table displays the constraint violations that were found.
Work with Constraint Results
The results table is a standard JMARS table. Right-click a table header to manage columns, change the column order, export the table to a CSV file, and access additional table options.
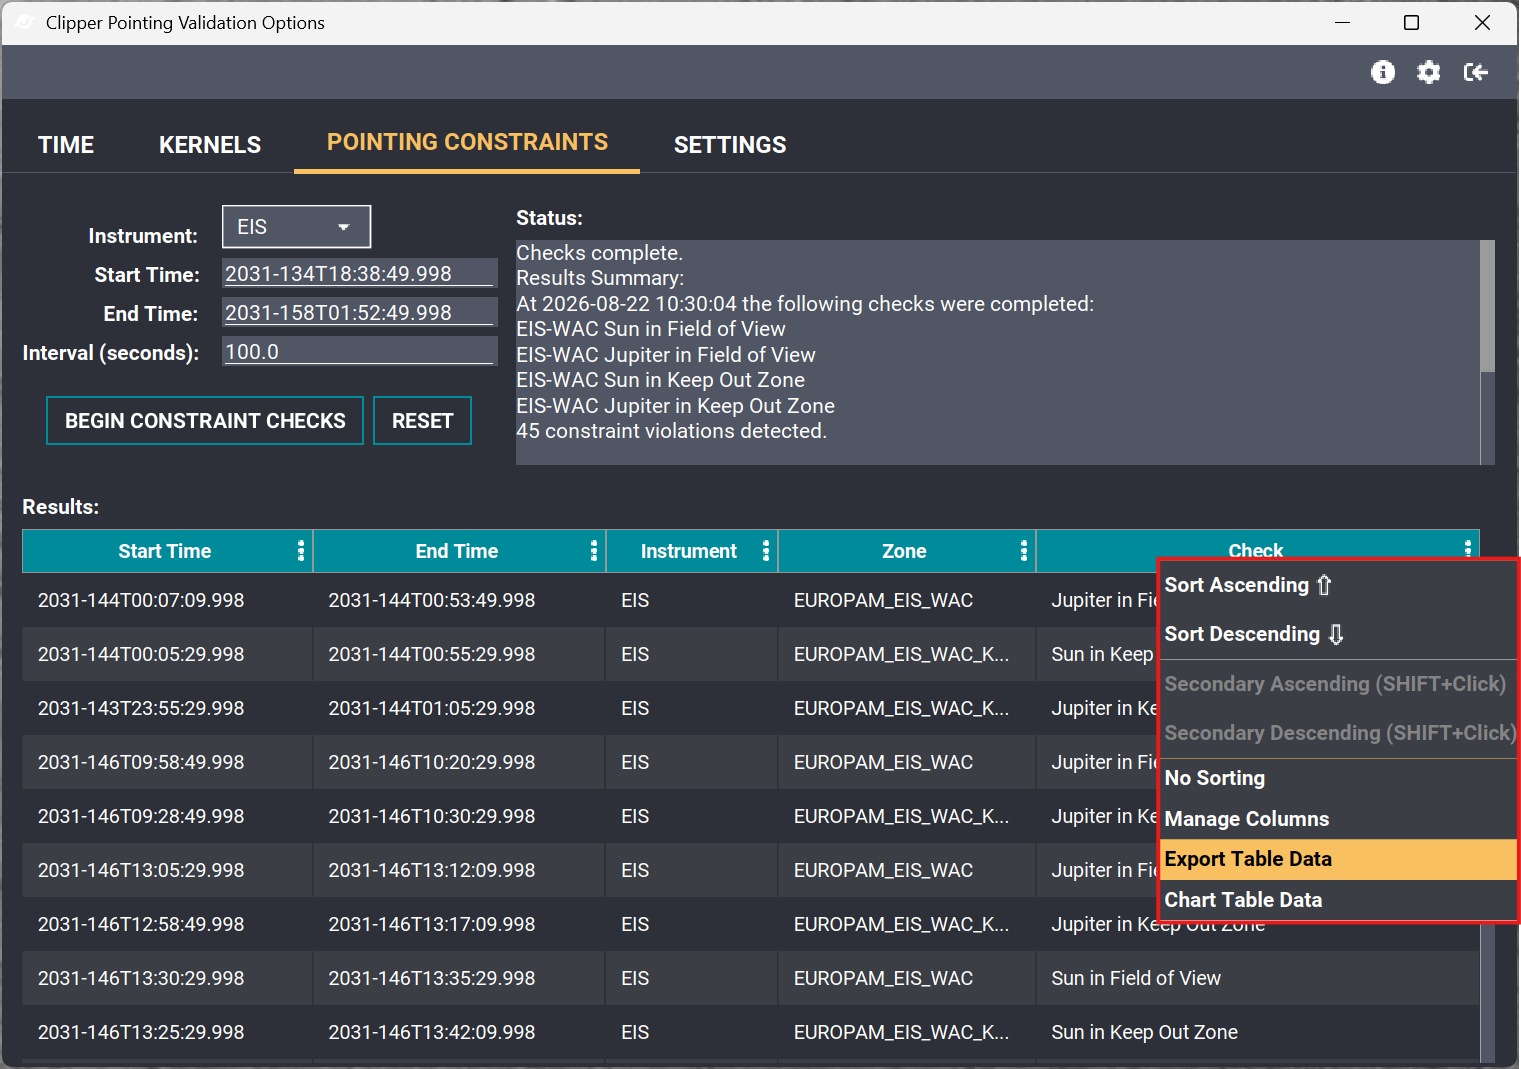
Right-click a table header to access the standard JMARS table options.
To navigate to a violation, select the violation in the table, right-click it, and select the option to jump to that specific violation.
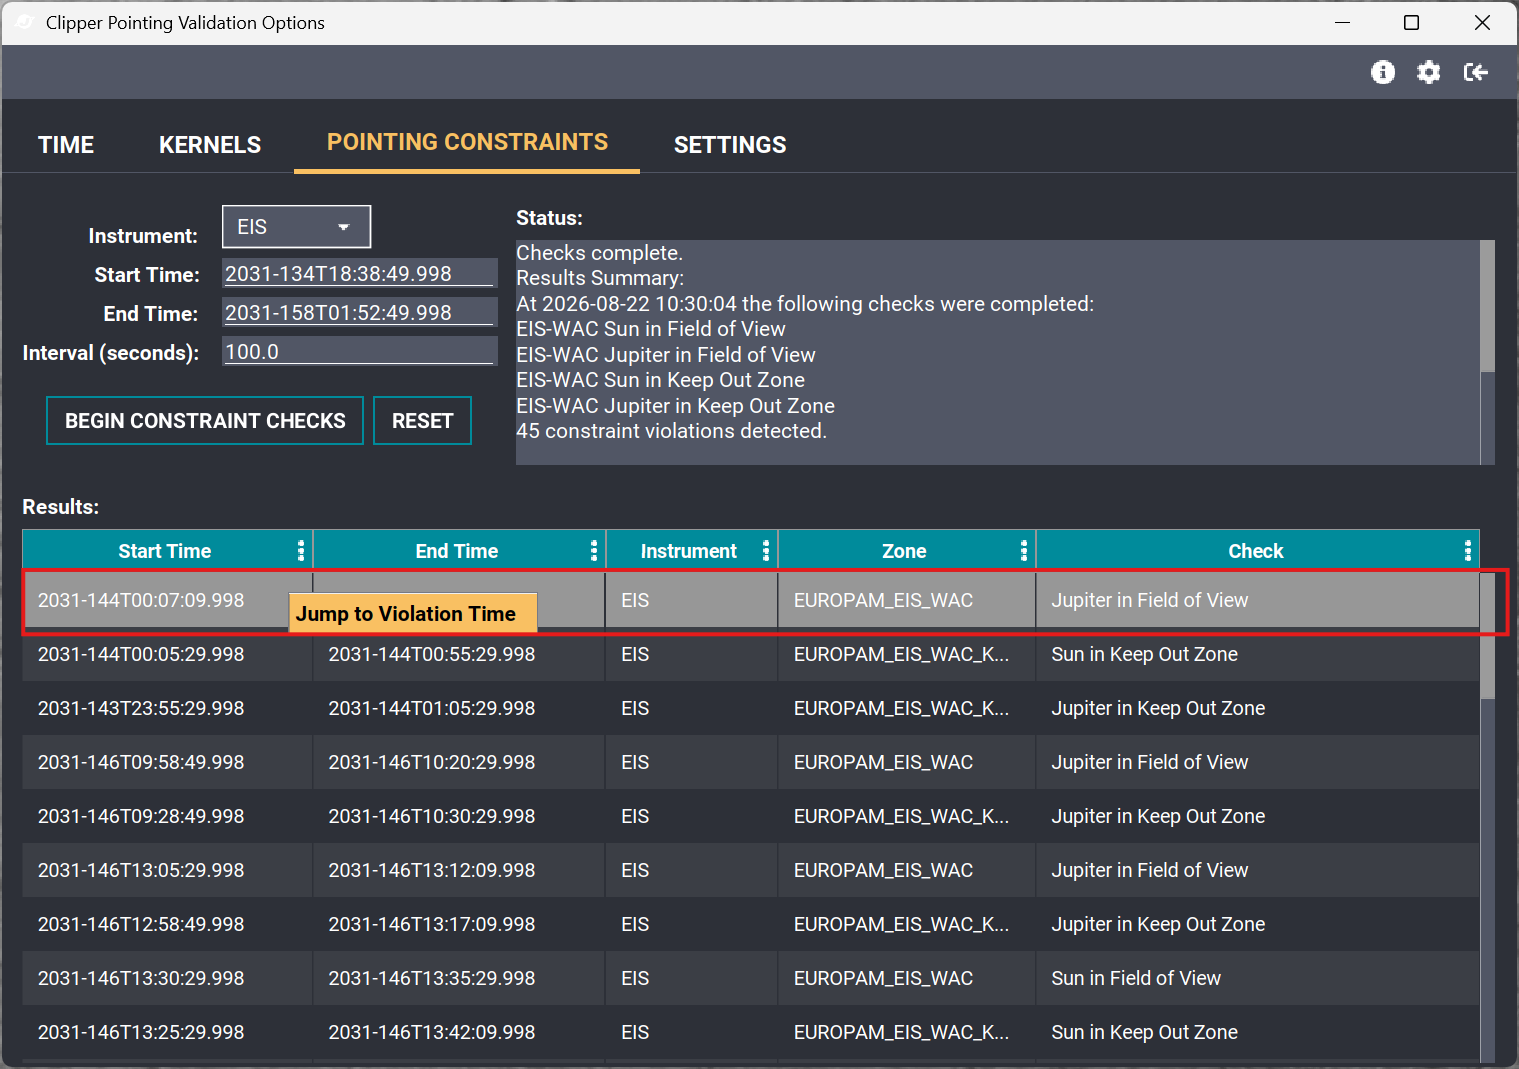
Select and right-click a violation to jump to its time in the plan.
Jump Result:
The ruler jumps to the selected violation's start time, and the 3D view updates to show the spacecraft geometry at that time. The vertical red line in the ruler and the time shown in the 3D view match the Start Time of the highlighted violation in the results table.
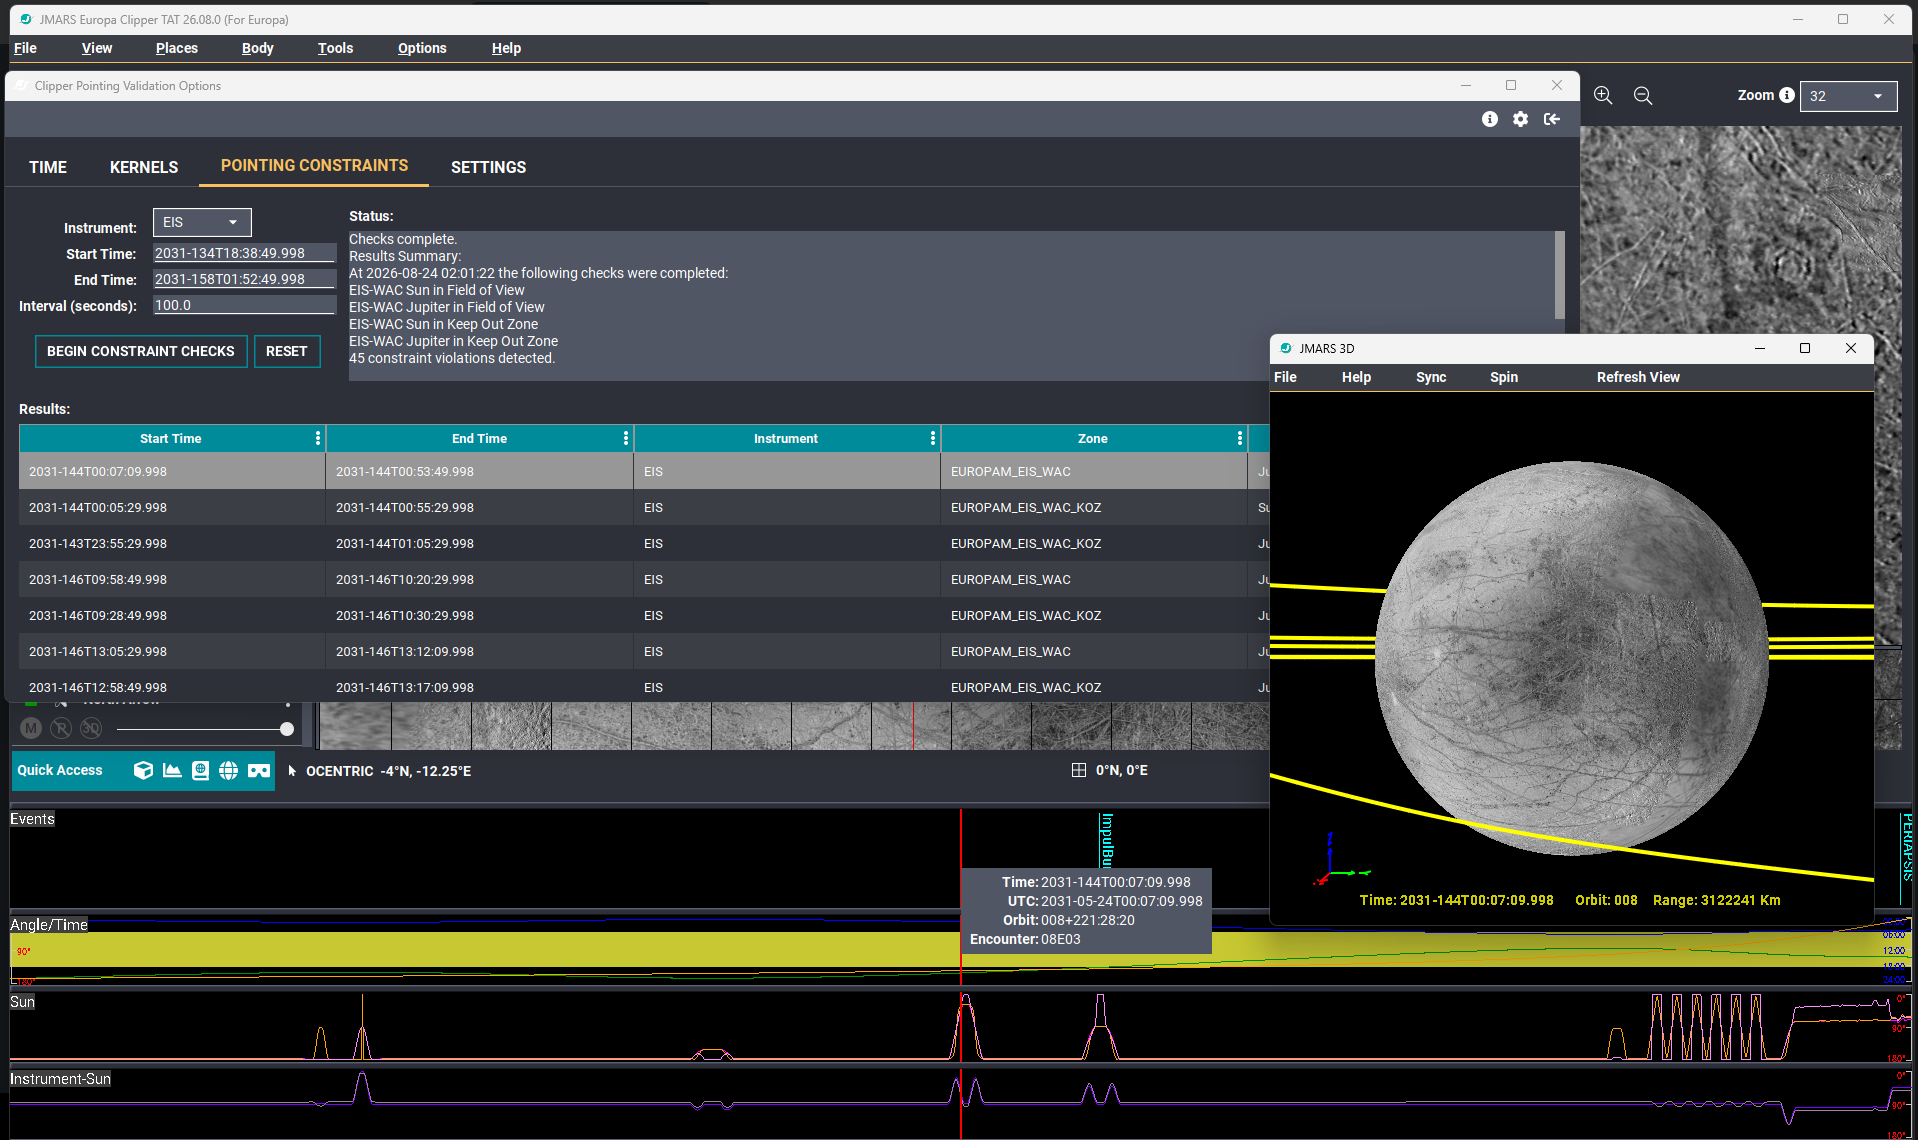
The highlighted violation, vertical red ruler line, and 3D view are synchronized to the selected violation's start time.
Day of Year Time Format
The time format throughout JMARS has been updated to display Day of Year.
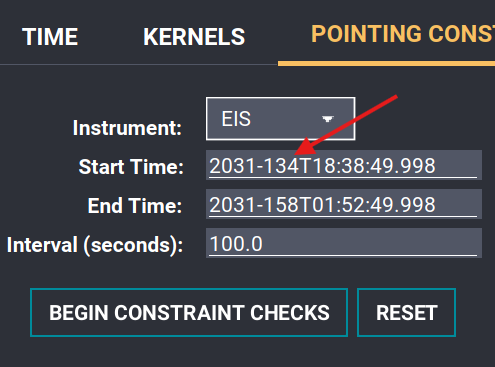
Time values throughout JMARS now display the Day of Year format.
Current Time Indicator in the Ruler
A vertical red line in the ruler marks the current time. Hover over the line to display the current time value. This time matches the focus panel and the 3D view.
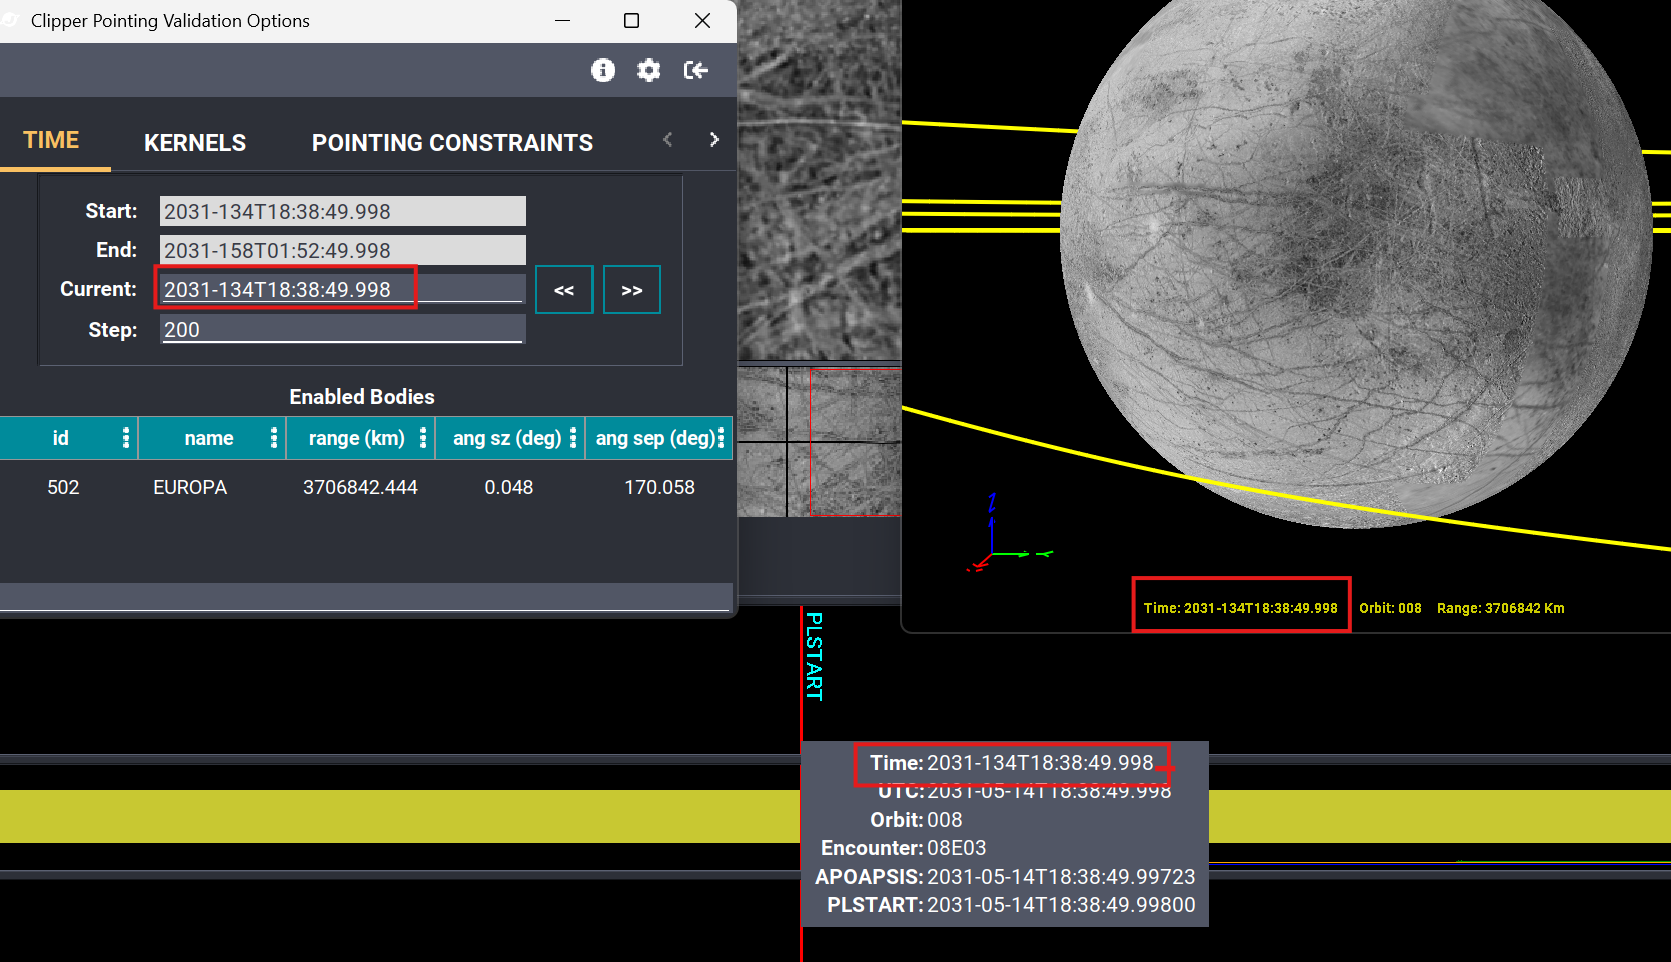
Hover over the vertical red line to display the current time.
Updated Spacecraft Model
The spacecraft model has been updated with additional detail and will continue to be refined in future releases.
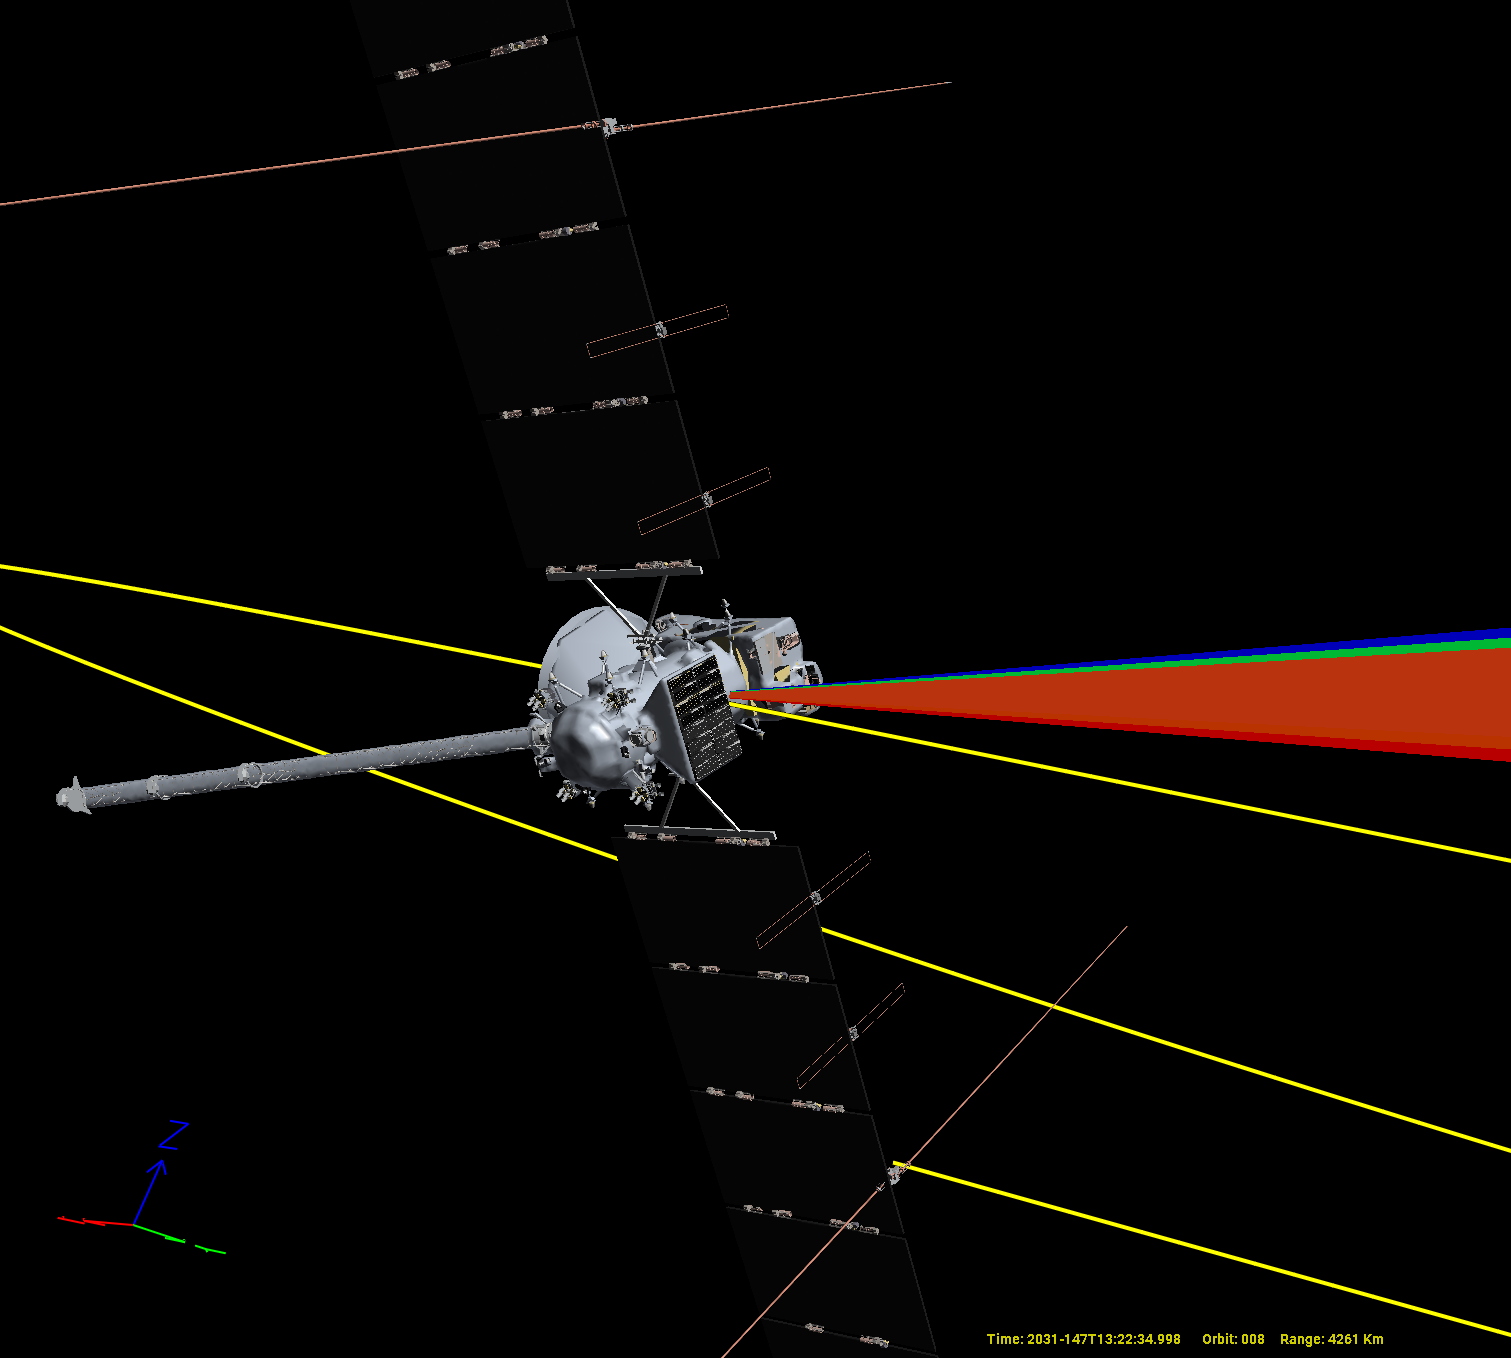
The updated spacecraft model includes additional visual detail.