
- Home
- Getting Started
- Documentation
- Release Notes
- Tour the Interface
- Tour the Layers
- JMARS Video Tutorials
- Lat/Lon Grid Layer
- Map Scalebar
- Nomenclature
- Crater Counting
- 3D
- Shape Layer
- Mosaics
- Map
- Advanced/Custom Maps
- Graphic/Numeric Maps
- Custom Map Sharing
- Stamp
- THEMIS
- MOC
- Viking
- CRISM Stamp Layer
- CTX
- HiRise
- HiRISE Anaglyph
- HiRISE DTM
- HRSC
- OMEGA
- Region of Interest
- TES
- THEMIS Planning
- Investigate Layer
- Landing Site Layer
- Tutorials
- Video Tutorials
- Displaying the Main View in 3D
- Finding THEMIS Observation Opportunities
- Submitting a THEMIS Region of Interest
- Loading a Custom Map
- Viewing TES Data in JMARS
- Using the Shape Layer
- Shape Layer: Intersect, Merge, and Subtract polygons from each other
- Shape Layer: Ellipse Drawing
- Shape Layer: Selecting a non-default column for circle-radius
- Shape Layer: Selecting a non-default column for fill-color
- Shape Layer: Add a Map Sampling Column
- Shape Layer: Adding a new color column based on the values of a radius column
- Shape Layer: Using Expressions
- Using JMARS for MSIP
- Introduction to SHARAD Radargrams
- Creating Numeric Maps
- Proxy/Firewall
- JMARS Shortcut Keys
- JMARS Data Submission
- FAQ
- Open Source
- References
- Social Media
- Podcasts/Demos
- Download JMARS
Graphic Maps
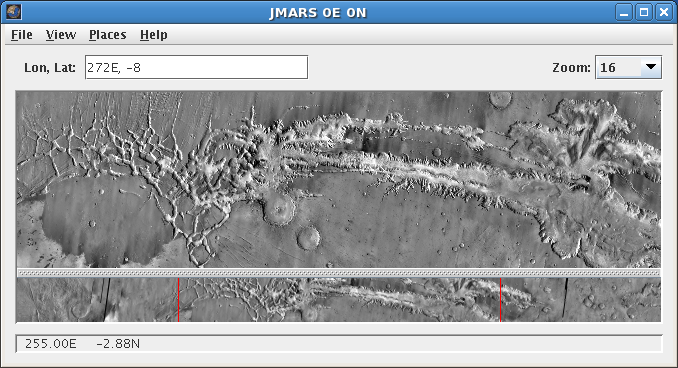
The Graphic Map Layer allows users to displays various global maps of Mars in the Viewing Window. These maps usually serve as the basis of the Viewing Window, with other layers (such as the ROI Layer, Groundtrack Layer, etc) displaying on top of them.
Open the Graphic Map Layer
-
- Open the Graphic Map Layer: Chose "Add New Layer" -> "Graphic Map" -> Choose a Map Type -> Choose a Map
- Using the Graphic Map Focus Panel: The Graphic and Numeric Map Layers are now simplified versions of the Advanced Map Layer with interfaces that long-time users will recognize. The focus panel in the Graphic Map Layer is identical to the focus panel in the Numeric Map Layer, but since the Graphic Maps have so data behind them no graphs will appear if users draw a profile line. Clicking on the "Configure" button will open up the settings window associated with the Advanced Map Layer and give users full control over all map settings. For more information, visit the Advanced Map Layer page.

Available Graphic Maps
- Detailed information about the following maps can be found on the JMARS Data Sets page.
- MAG/ER Maps: The MAG/ER Map was produced by the Magnetometer/Electron Reflectometer experiment aboard Mars Global Surveyor
-
-
- MAG/ER Global Magnetic Field
-
- MOC Maps: The MOC maps were created from images taken by MOC's Wide-Angle Camera.
-
-
- Wide_Angle Map (64ppd)
- Wide-Angle Map (Atlas)
-
- MOLA Maps: The MOLA maps were produced by creating a visual depiction of the MOLA altitude data points.
-
-
- Shaded Relief
- Colorized Elevation
- Vertical Roughness
- Mo_lag 128
-
- Mosaic Maps: The Mosaic maps were created using high-quality THEMIS VIS and IR images.
-
-
- Carr Mosaics
-
- Channels
-
- Granicus Tinjar (Day IR)
- Ravis_Vallis (Night IR)
- Tui Vallis (Day IR)
- Valles Marineris (Day IR)
- Warrego Valles (Day IR)
- Craters
-
- Loire Parana (Day IR)
- Lakes
-
- Lunar Planum (Day IR)
- Palos Crater(Day IR)
- Volcanoes
-
- Apollinaris Patera (Day IR)
- Hadriaca Patera (Day IR)
- Hecates Tholus (Day IR)
- Northwest Alba Patera (Day IR)
- Olympus Mons (Day IR)
- Tyrrhena Patera (Day IR)
- MSL Landing Site Mosaics
-
- Eberswalde Crater:
-
- Eberswalde Crater (Day IR)
- Eberswalde Crater (Night IR)
- Eberswalde Crater (VIS)
- Holden Crater Fan
-
- Holden Crater Fan (Day IR)
- Holden Crater Fan (Night IR)
- Holden Crater Fan (VIS)
- Marwth Vallis
-
- Marwth Vallis (Day IR)
- Marwth Vallis (Night IR)
- Marwth Vallis (VIS)
- Nili Fossae Trough
-
- Nili Fossae Trough (Day IR)
- Nili Fossae Trough (Night IR)
- Nili Fossae Trough (VIS)
- Terby Crater
-
- Terby Crater (Day IR)
- Terby Crater (Night IR)
- Terby Crater (VIS)
-
- TES Maps: These TES maps were created by ASU's Thermal Emission Spectrometer aboard the Mars Global Surveyor
-
-
- TES Albedo
- TES Dust Cover Index
- TES Thermal Inertia (Christensen)
- TES Thermal Inertia (Putzig et al.)
- TES Derived Unit Map
-
- TES Mineral Maps: These TES maps were created by processing data from ASU's Thermal Emission Spectrometer aboard the Mars Global Surveyor
-
-
- TES Amphibole
- TES Andesite
- TES Basalt
- TES Carbonate
- TES Hematite
- TES High-Ca Pyroxene
- TES K-Feldspar
- TES Low-Ca Pyroxene
- TES Olivine
- TES Plagioclase
- TES Quartz
- TES RMS Error
- TES Sheet Silicates/High-Si Glass
- TES Sulfate
- TES Surface Dust
-
- THEMIS Maps: The THEMIS maps were created by ASU's Thermal Emission Imaging System aboard the Mars Odyssey
-
-
- THEMIS Day IR (256ppd)
- THEMIS Night IR (256ppd)
-
- Viking Maps: The Viking maps were produced by various instruments aboard the two Viking orbiters.
-
-
- MDIM 2.1
- IRTM Albedo
- IRTM Fine Component Thermal Inertia
- IRTM Rock Abundance
- IRTM Thermal Inertia
- Merged Color Mosaic
-
- THEMIS NPLD: The THEMIS seasonal VIS maps of the North polar cap produced by the North Pole Layered Deposits campaign.
-
-
- Spring 36m (512ppd)
- Summer 36m (512ppd)
- Summer 18m (1024ppd)
-
- THEMIS SPLD: The THEMIS seasonal VIS maps of the South polar cap produced by the South Pole Layered Deposits campaign.
-
-
- Spring 36m (512ppd)
- Spring Special 36m (512ppd)
- Summer 36m (512ppd)
- Summer 18m (1024ppd)
-
Related Pages
-
- Tutorial #1: Viewing THEMIS VIS Coverage
- Tutorial #2: Displaying the Main View in 3D
- Tutorial #3: Finding THEMIS Observation Opportunities