- Home
- Getting Started
- Documentation
- Release Notes
- Tour the Interface
- Tour the Layers
- JMARS Video Tutorials
- Lat/Lon Grid Layer
- Map Scalebar
- Nomenclature
- Crater Counting
- 3D
- Shape Layer
- Mosaics
- Map
- Advanced/Custom Maps
- Graphic/Numeric Maps
- Custom Map Sharing
- Stamp
- THEMIS
- MOC
- Viking
- CRISM Stamp Layer
- CTX
- HiRise
- HiRISE Anaglyph
- HiRISE DTM
- HRSC
- OMEGA
- Region of Interest
- TES
- THEMIS Planning
- Investigate Layer
- Landing Site Layer
- Tutorials
- Video Tutorials
- Displaying the Main View in 3D
- Finding THEMIS Observation Opportunities
- Submitting a THEMIS Region of Interest
- Loading a Custom Map
- Viewing TES Data in JMARS
- Using the Shape Layer
- Shape Layer: Intersect, Merge, and Subtract polygons from each other
- Shape Layer: Ellipse Drawing
- Shape Layer: Selecting a non-default column for circle-radius
- Shape Layer: Selecting a non-default column for fill-color
- Shape Layer: Add a Map Sampling Column
- Shape Layer: Adding a new color column based on the values of a radius column
- Shape Layer: Using Expressions
- Using JMARS for MSIP
- Introduction to SHARAD Radargrams
- Creating Numeric Maps
- Proxy/Firewall
- JMARS Shortcut Keys
- JMARS Data Submission
- FAQ
- Open Source
- References
- Social Media
- Podcasts/Demos
- Download JMARS
JMARS release 5.6.2
JMARS release 5.6.2: Export Numeric Data, Enhanced Shape Tools, and New Colormap Options
Release 5.6.2
What’s New in JMARS
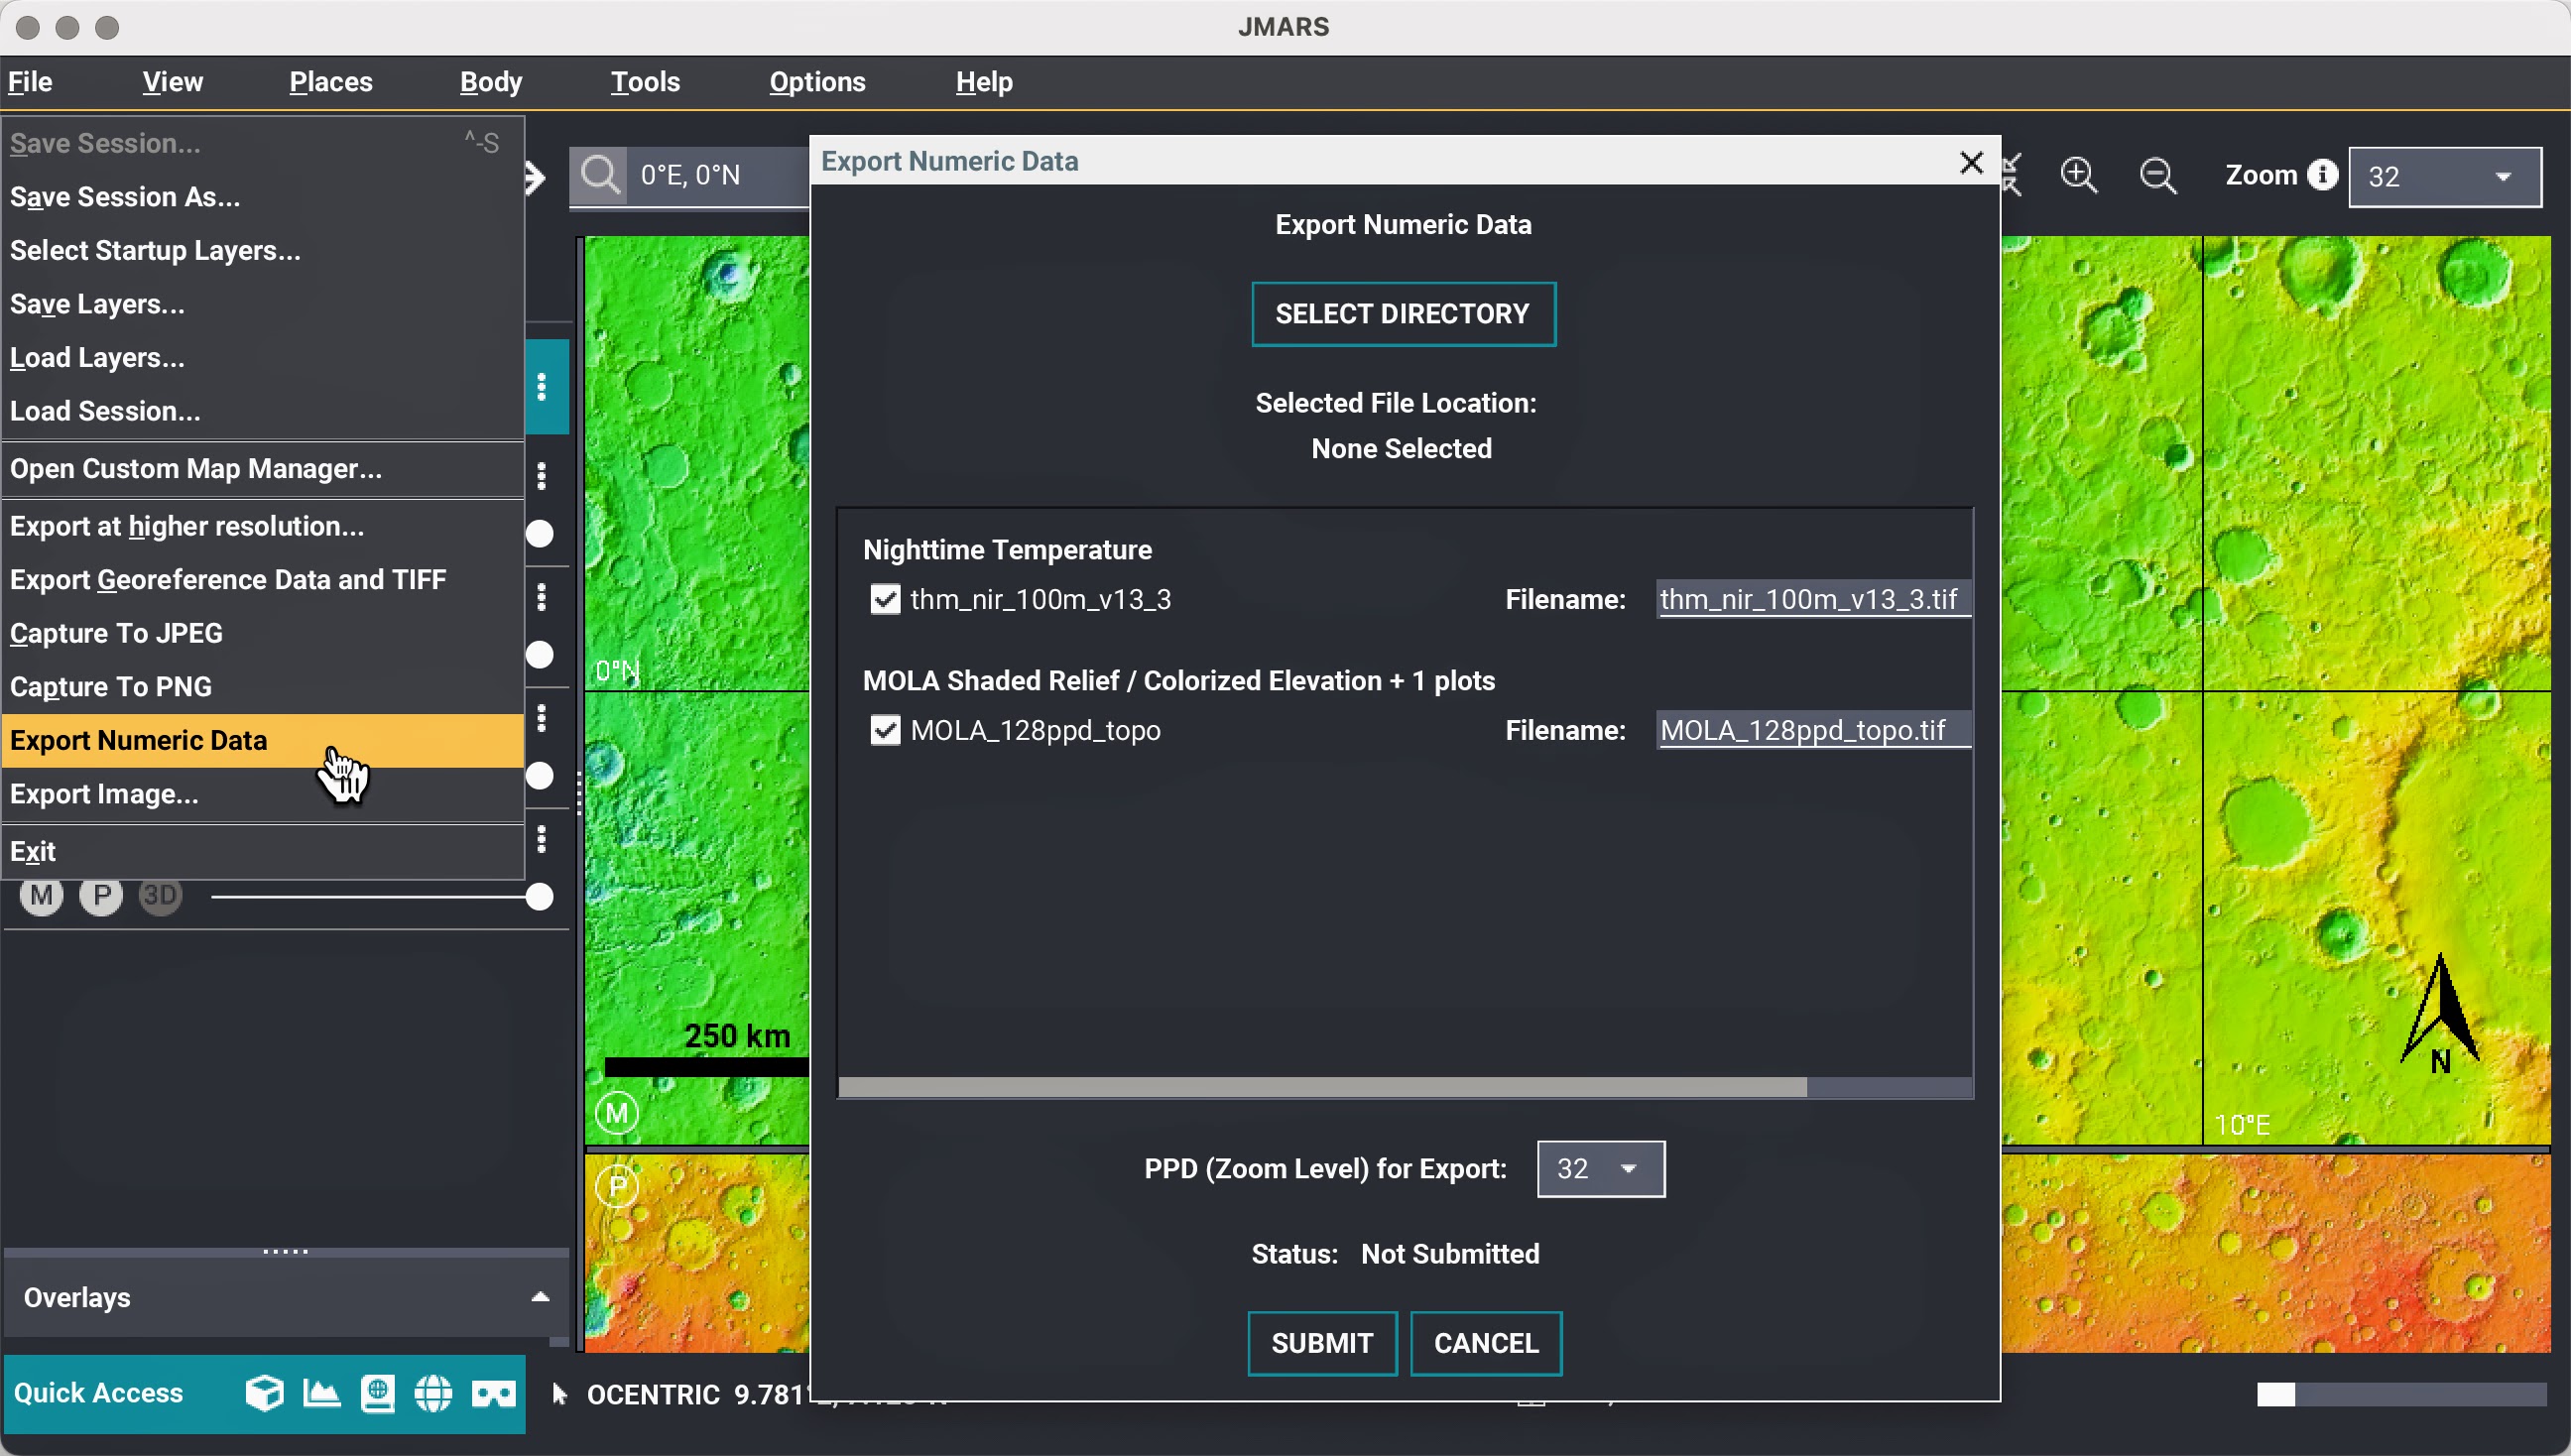
1) Export Numeric Data
You can now export numeric data from map layers you’ve loaded in JMARS. This makes it easier to analyze and share the underlying values outside the application.
2) Improved Shape Layer Tools
The geometry source dialog for shape layers has been updated to provide better support for creating and editing circles and ellipses.
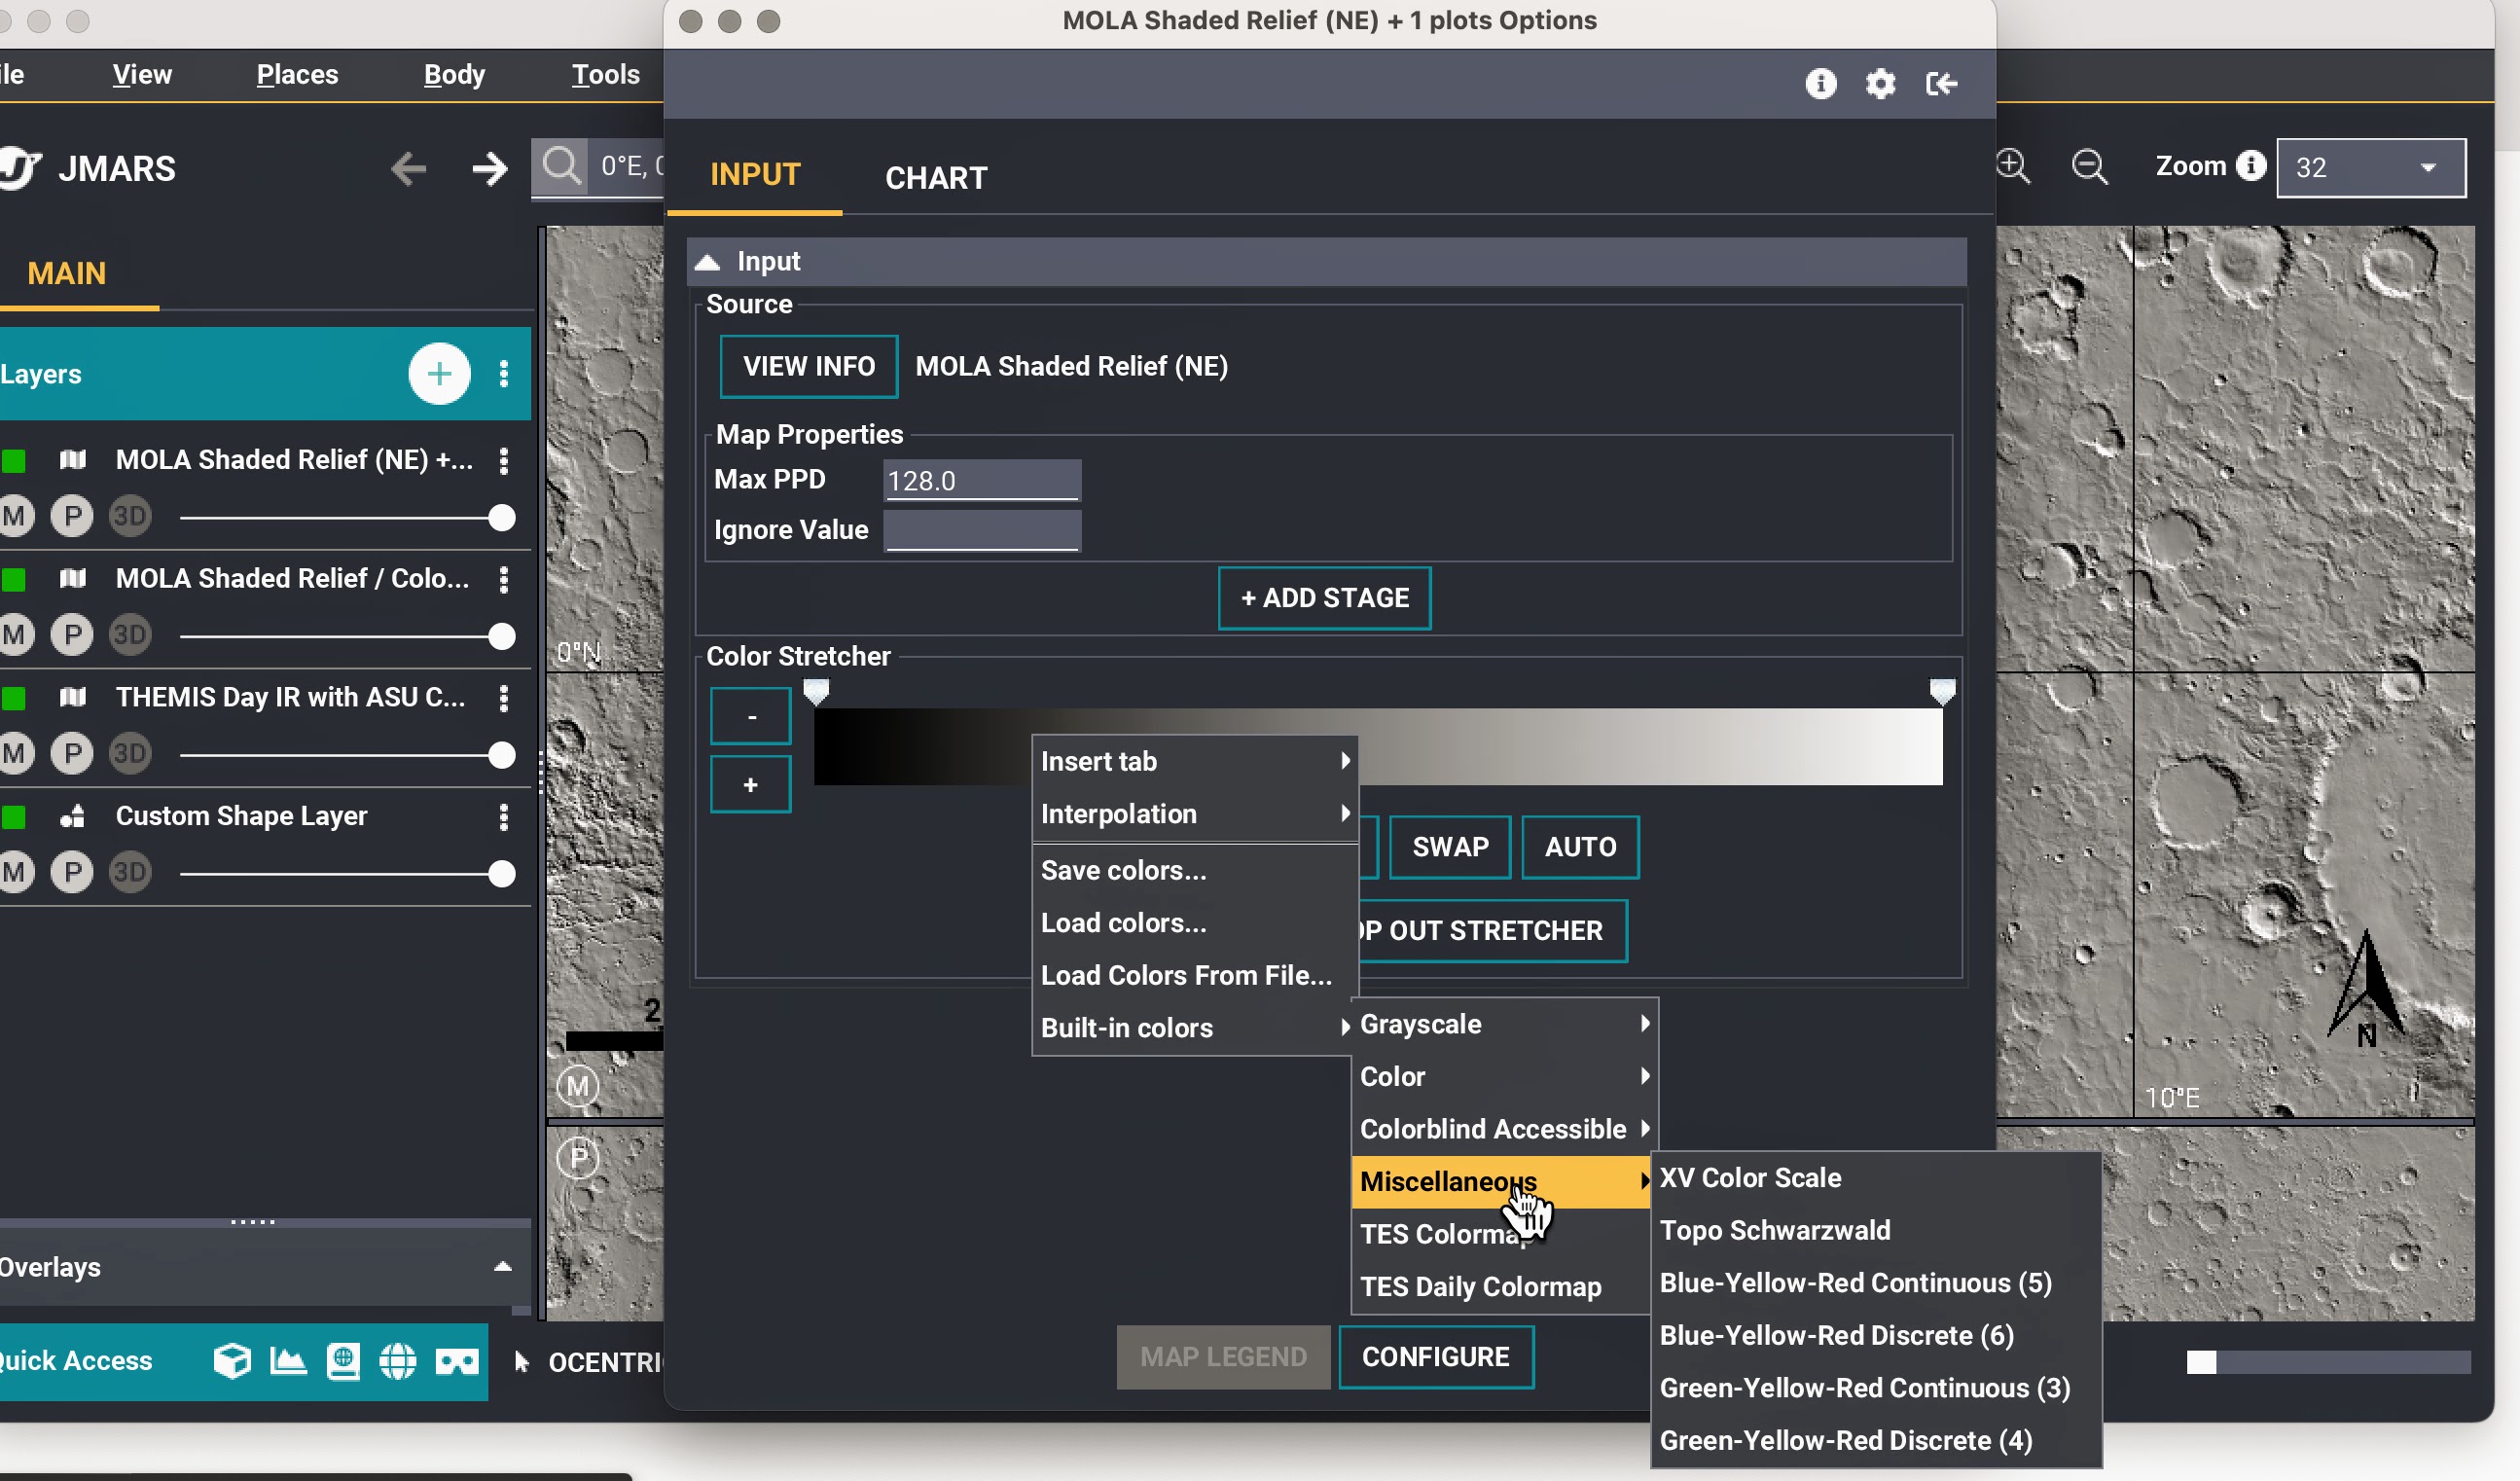
3) New Colormap Options
Four new colormap options have been added as commonly used ramps for visualizing slope data. You’ll find them under the Misc section in the color ramp menu.