- Home
- Getting Started
- Documentation
- Release Notes
- Tour the Interface
- Tour the Layers
- JMARS Video Tutorials
- Lat/Lon Grid Layer
- Map Scalebar
- Nomenclature
- Crater Counting
- 3D
- Shape Layer
- Mosaics
- Map
- Advanced/Custom Maps
- Graphic/Numeric Maps
- Custom Map Sharing
- Stamp
- THEMIS
- MOC
- Viking
- CRISM Stamp Layer
- CTX
- HiRise
- HiRISE Anaglyph
- HiRISE DTM
- HRSC
- OMEGA
- Region of Interest
- TES
- THEMIS Planning
- Investigate Layer
- Landing Site Layer
- Tutorials
- Video Tutorials
- Displaying the Main View in 3D
- Finding THEMIS Observation Opportunities
- Submitting a THEMIS Region of Interest
- Loading a Custom Map
- Viewing TES Data in JMARS
- Using the Shape Layer
- Shape Layer: Intersect, Merge, and Subtract polygons from each other
- Shape Layer: Ellipse Drawing
- Shape Layer: Selecting a non-default column for circle-radius
- Shape Layer: Selecting a non-default column for fill-color
- Shape Layer: Add a Map Sampling Column
- Shape Layer: Adding a new color column based on the values of a radius column
- Shape Layer: Using Expressions
- Using JMARS for MSIP
- Introduction to SHARAD Radargrams
- Creating Numeric Maps
- Proxy/Firewall
- JMARS Shortcut Keys
- JMARS Data Submission
- FAQ
- Open Source
- References
- Social Media
- Podcasts/Demos
- Download JMARS
Scatterplots with stamps
Scatter plots can created using any stamps that are available in JMARS. The x and y-axis can be chosen based off the available metadata that is associated with each stamp.
Create a scatter plot using stamps!
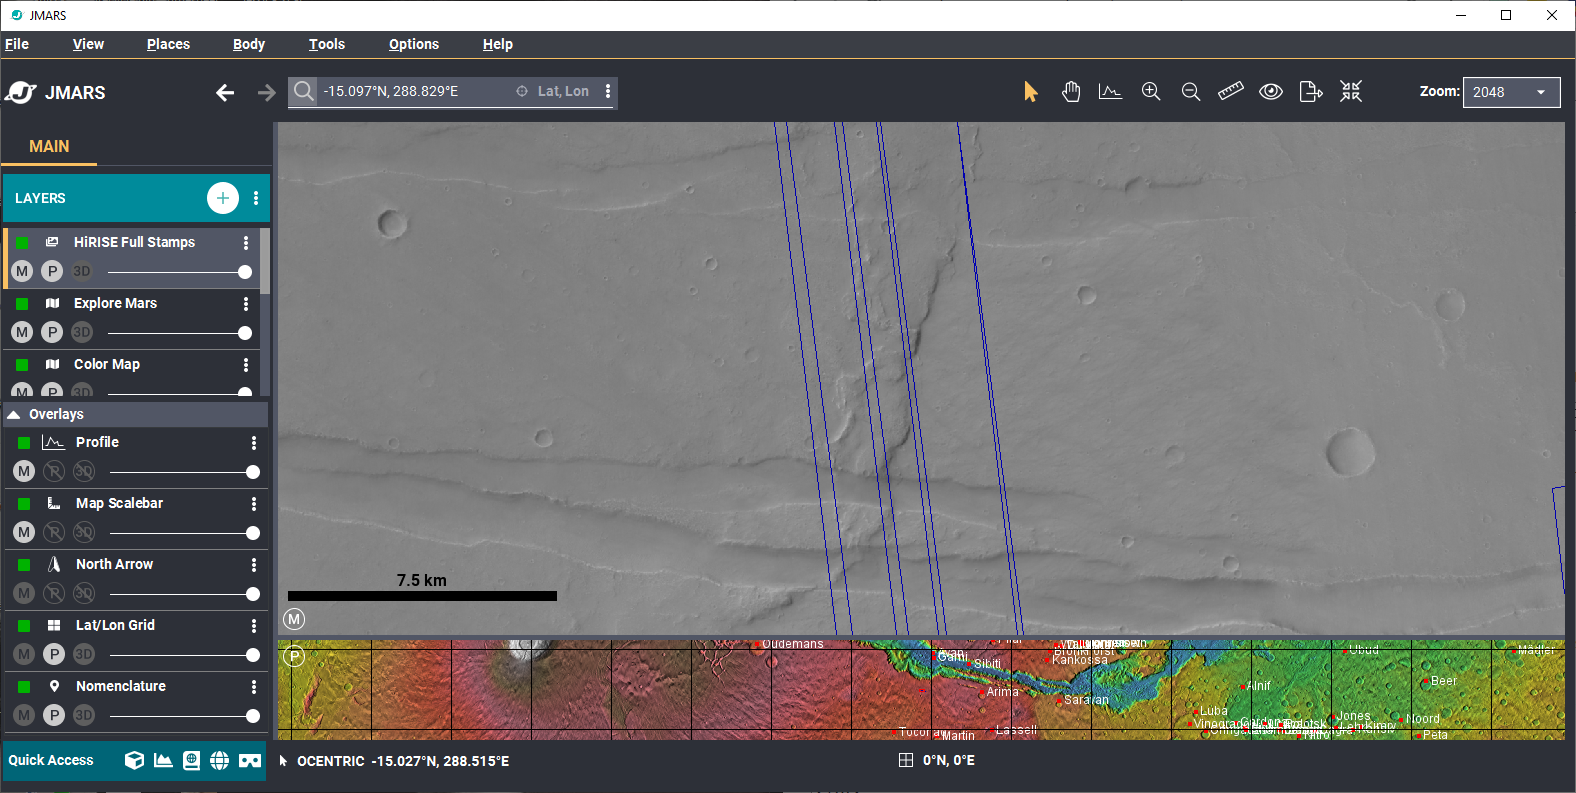
- The scatter plot can be used on any stamp. In this tutorial, we will be using the HiRISE stamps.
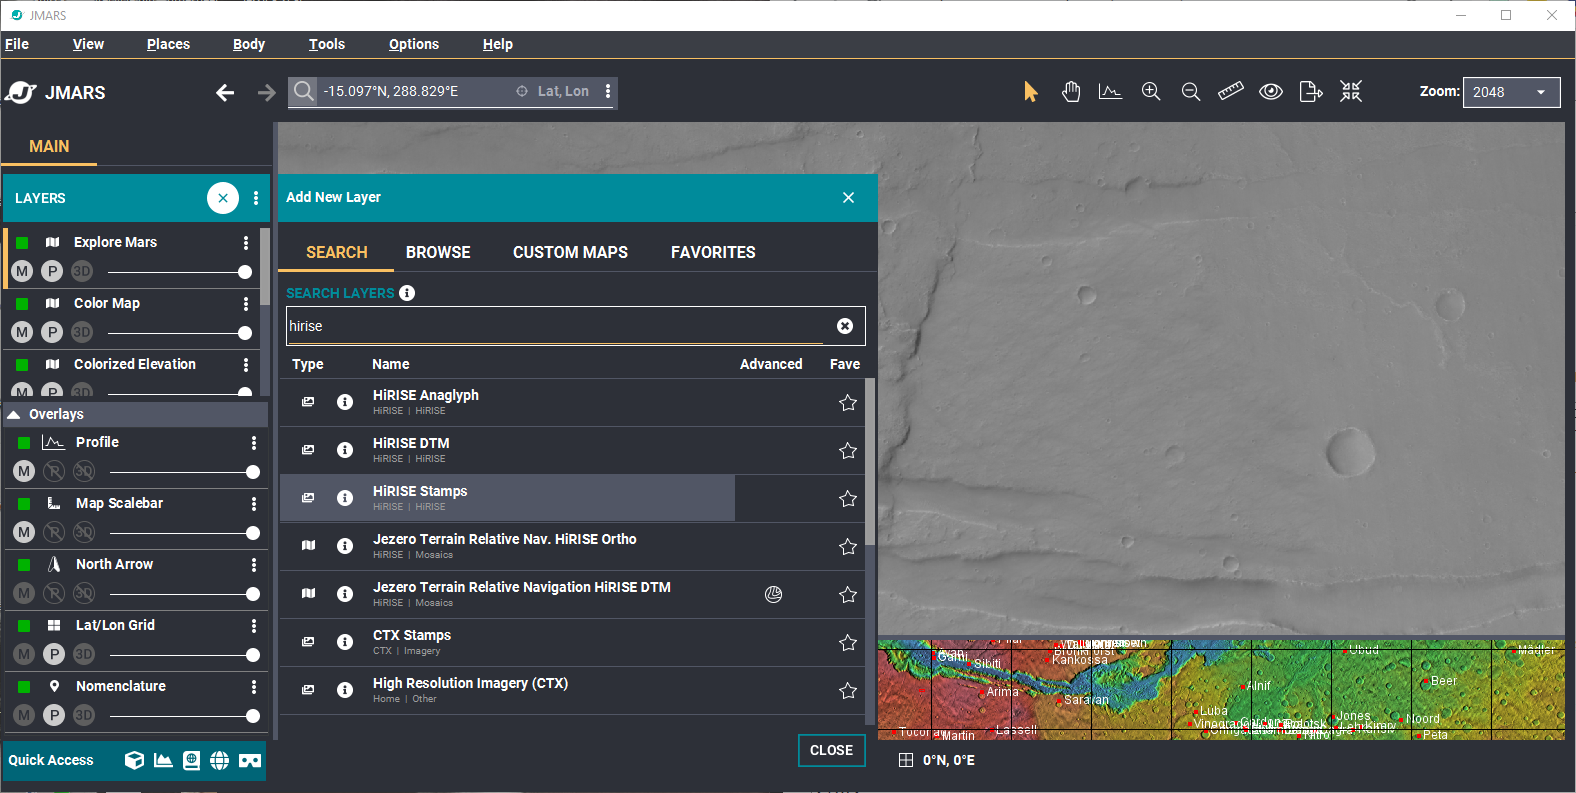
- Add the HiRISE stamps to the layer manager. First, press the add layer button ("+"). This will open the layer manager.
- Search for HiRISE and click, "HiRISE Stamps".
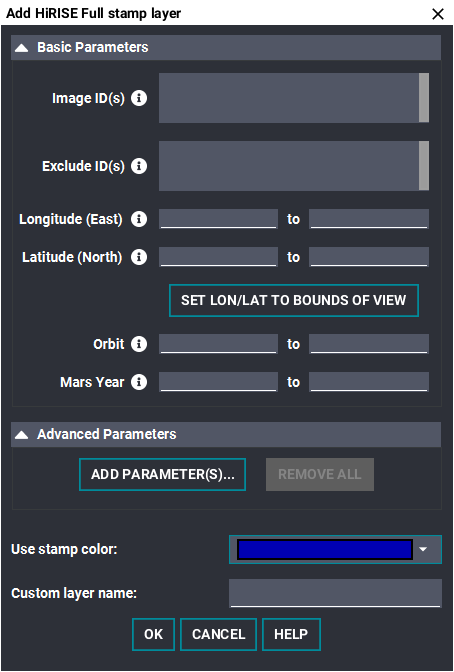
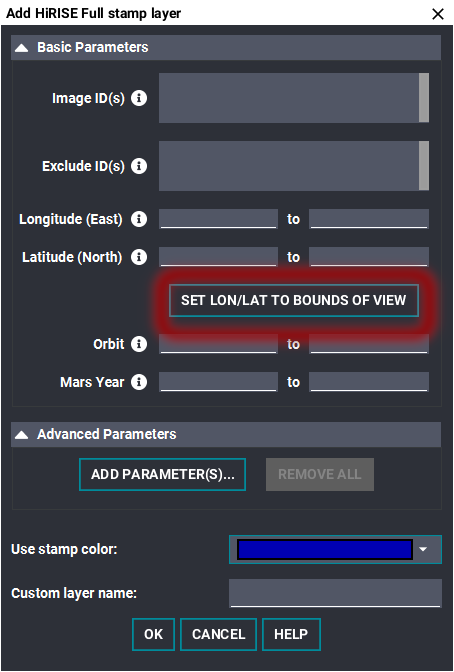
- The "Add HiRISE Full Stamp Layer" dialog box will open. Here, you can add stamps by entering the lon/lat bounding box OR add stamps to the mainview by clicking the "Set Lon/Lat to Bounds of View" button.
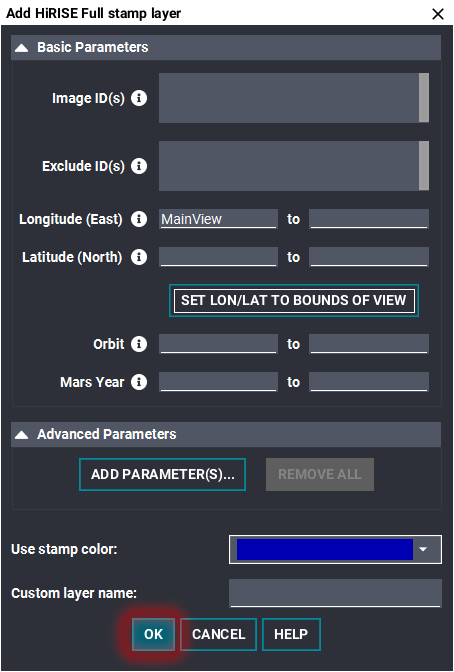
- Click, "OK" to add stamps to the mainview.
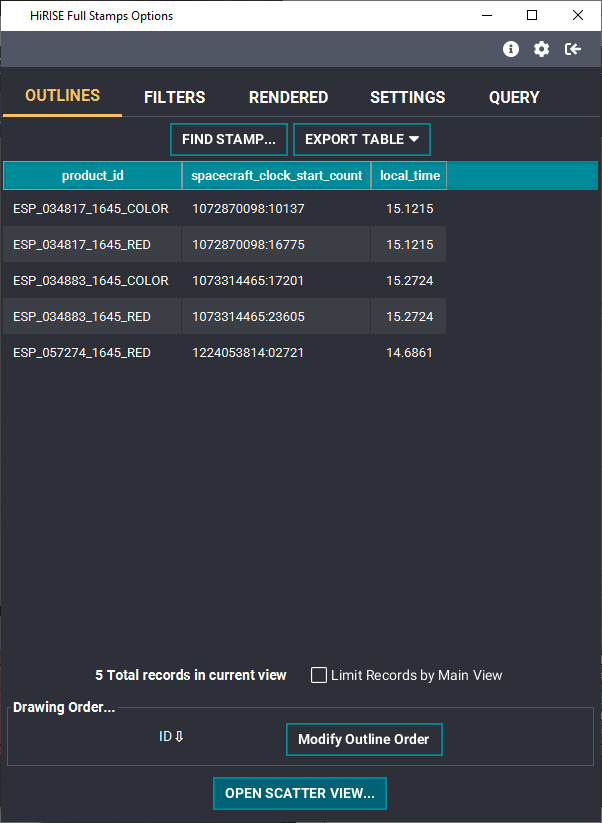
- Double click the HiRISE stamp layer in the layer manager to open the stamp option dialog window.
- At the bottom of the window, click, "Open Scatter View".
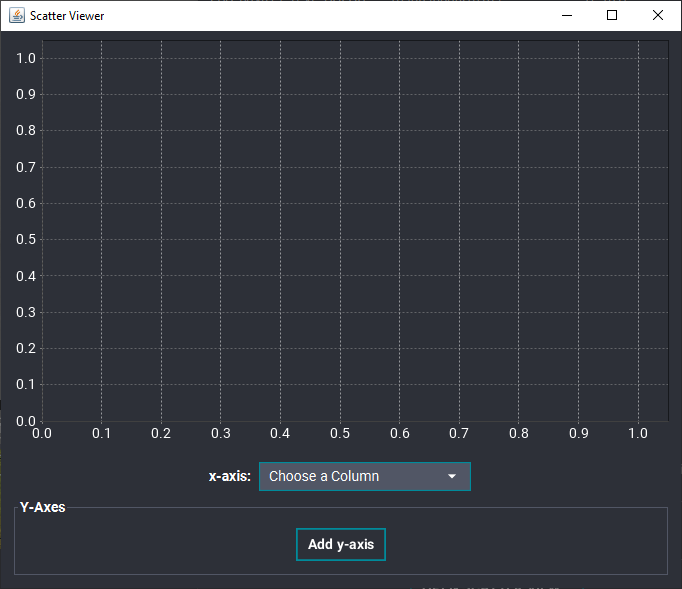
- The scatter plot window will open. For the scatter plot to work, the x and y-axis will need to add. Click x-axis to pick a desired value for the x-axis. Then, do the same for the y-axis. *NOTE*: More than one y-axis value can be added.
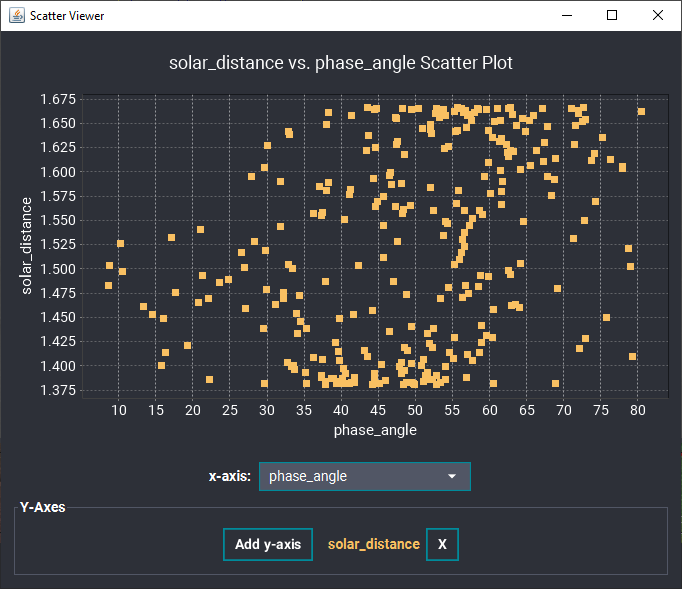
- For this example, we have added "phase_angle" to the x-axis and "solar_distance" to the y-axis.